This site uses cookies to improve your experience. To help us insure we adhere to various privacy regulations, please select your country/region of residence. If you do not select a country, we will assume you are from the United States. Select your Cookie Settings or view our Privacy Policy and Terms of Use.
Cookie Settings
Cookies and similar technologies are used on this website for proper function of the website, for tracking performance analytics and for marketing purposes. We and some of our third-party providers may use cookie data for various purposes. Please review the cookie settings below and choose your preference.
Used for the proper function of the website
Used for monitoring website traffic and interactions
Cookie Settings
Cookies and similar technologies are used on this website for proper function of the website, for tracking performance analytics and for marketing purposes. We and some of our third-party providers may use cookie data for various purposes. Please review the cookie settings below and choose your preference.
Strictly Necessary: Used for the proper function of the website
Performance/Analytics: Used for monitoring website traffic and interactions
But often that’s how we present statistics: we just show the notes, we don’t play the music.” – Hans Rosling, Swedish statistician. Data visualization, or ‘data viz’ as it’s commonly known, is the graphic presentation of data. That’s a colossal number of books on visualization. Data visualization: What You Need To Know.
6) Data Quality Metrics Examples. Reporting being part of an effective DQM, we will also go through some data quality metrics examples you can use to assess your efforts in the matter. It involves: Reviewing data in detail Comparing and contrasting the data to its own metadata Running statistical models Data quality reports.
Turnover rates have taken center stage in workforce discussions, often being the first metric leaders request when assessing the state of the workforce. As leaders, we often report a series of metrics out of habitcost per hire sounds strategic, but it doesnt often lead to insights about long-term performance or retention.
Data analysis method focuses on strategic approaches to taking raw data, mining for insights that are relevant to the business’s primary goals, and drilling down into this information to transform metrics, facts, and figures into initiatives that benefit improvement. Conduct statistical analysis. Visualize your data.
1) What Are Product Metrics? 2) Types Of Product Metrics. 3) Product Metrics Examples You Can Use. 4) Product Metrics Framework. The right product performance metrics will give you invaluable insights into its health, strength and weaknesses, potential issues or bottlenecks, and let you improve it greatly.
Modern dashboard software makes it simpler than ever to merge and visualize data in a way that’s as inspiring as it is accessible. Knowing what story you want to tell (analyzing the data) tells you which data visualization type to use. Let’s assume you have the right data and the right data visualization software. Distribution.
Today we are pleased to announce a new class of Amazon CloudWatch metrics reported with your pipelines built on top of AWS Glue for Apache Spark jobs. The new metrics provide aggregate and fine-grained insights into the health and operations of your job runs and the data being processed. workerUtilization showed 1.0
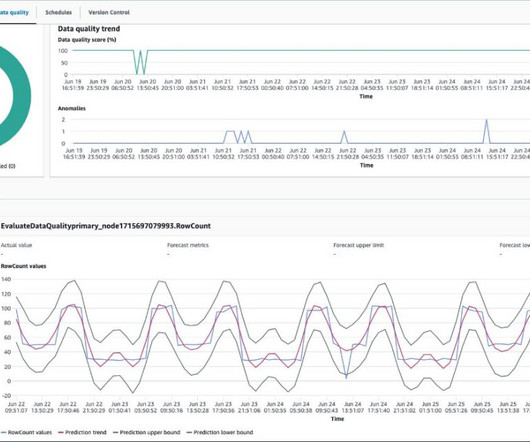
It’s important for business users to be able to see quality scores and metrics to make confident business decisions and debug data quality issues. It provides insights and metrics related to the performance and effectiveness of data quality processes. We can analyze the data quality score and metrics using Athena SQL queries.
Data visualization has become a major part of life for those looking to make use of the large swathes of data available in the modern world. That’s where data visualization comes in. Data visualization is, to put it simply, converting hard data and lists of numbers or facts, into an easier to comprehend form.
While analytical reporting is based on statistics, historical data and can deliver a predictive analysis of a specific issue, its usage is also spread in analyzing current data in a wide range of industries. A modern data report offers a host of interactive data charts and visualizations you can use to your advantage.
Read here how these metrics can drive your customers’ satisfaction up! Customer satisfaction metrics evaluate how the products or services supplied by a company meet or surpass a customer’s expectations. You can use different scales to measure the experience or emojis (visual representation of satisfactory levels).
While sometimes it’s okay to follow your instincts, the vast majority of your business-based decisions should be backed by metrics, facts, or figures related to your aims, goals, or initiatives that can ensure a stable backbone to your management reports and business operations. Quantitative data analysis focuses on numbers and statistics.
Stories inspire, engage, and have the unique ability to transform statistical information into a compelling narrative that can significantly enhance business success. According to a study performed by Skyword, content that features a mix of words and visuals drives 34% more engagement than text-only articles, blog posts, or whitepapers.
Typically presented in the form of an interactive dashboard , this kind of report provides a visual representation of the data associated with your predetermined set of key performance indicators – or KPI data, for short. Set up a report which you can visualize with an online dashboard. Consider your data sources. 2) Select your KPIs.
While some experts try to underline that BA focuses, also, on predictive modeling and advanced statistics to evaluate what will happen in the future, BI is more focused on the present moment of data, making the decision based on current insights. But let’s see in more detail what experts say and how can we connect and differentiate the both.
According to the US Bureau of Labor Statistics, demand for qualified business intelligence analysts and managers is expected to soar to 14% by 2026, with the overall need for data professionals to climb to 28% by the same year. The Bureau of Labor Statistics also states that in 2015, the annual median salary for BI analysts was $81,320.
Spreadsheets finally took a backseat to actionable and insightful data visualizations and interactive business dashboards. Companies are no longer wondering if data visualizations improve analyses but what is the best way to tell each data-story. 2) Data Discovery/Visualization. Data exploded and became big.
A data scientist must be skilled in many arts: math and statistics, computer science, and domain knowledge. No matter your skill, career level, or title, the ability to analyze, organize, and visualize data are vital skills in our world of quickly growing and ever-changing data. Statistics and programming go hand in hand.
Through the art of streamlined visual communication, data dashboards permit businesses to engage in real-time and informed decision-making and are key instruments in data interpretation. More often than not, it involves the use of statistical modeling such as standard deviation, mean and median. agree, strongly agree, disagree, etc.).
Amazon Redshift provides performance metrics and data so you can track the health and performance of your provisioned clusters, serverless workgroups, and databases. This feature is part of the Amazon Redshift console and provides a visual and graphical representation of the query’s run order, execution plan, and various statistics.
By harnessing the insights, information, and metrics that are most valuable to key aspects of your business and understanding how to take meaningful actions from your data, you will ensure your business remains robust, resilient, and competitive. The Link Between Data And Business Performance. What Is A Performance Dashboard In Business?
After you create a connection once, you can choose to use the same connection across various AWS Glue components including Glue ETL, Glue Visual ETL and zero-ETL. Amazon CloudWatch , a monitoring and observability service, collects logs and metrics from the data integration process. Check CloudWatch log events for the SEED Load.
Run the job for 6 days and explore how AWS Glue Data Quality learns from data statistics and detects anomalies. Create an AWS Glue visual ETL job Complete the following steps: On the AWS Glue console, create a new AWS Glue visual job named anomaly-detection-blog-visual. For Statistics , enter RowCount.
The human brain processes visual data better than any other kind of data, which is good because about 90% of the information our brains process is visual. Visual processing and responses both occur more quickly compared to other stimuli. The brain processes data in visuals or images faster than data in text or rows of numbers.
Business analytics is the practical application of statistical analysis and technologies on business data to identify and anticipate trends and predict business outcomes. Business analytics also involves data mining, statistical analysis, predictive modeling, and the like, but is focused on driving better business decisions.
The purpose is not to track every statistic possible, as you risk being drowned in data and losing focus. IT reports, visualized through a professional online dashboard , come in handy because they give an idea of the current situation in a glimpse. What kind of metrics matter to my audience?
4) How to Select Your KPIs 5) Avoid These KPI Mistakes 6) How To Choose A KPI Management Solution 7) KPI Management Examples Fact: 100% of statistics strategically placed at the top of blog posts are a direct result of people studying the dynamics of Key Performance Indicators, or KPIs. 3) What Are KPI Best Practices?
We gave you a curated list of our top 15 data analytics books , top 18 data visualization books , top 16 SQL books – and, as promised, we’re going to tell you all about the world’s best books on data science. 8) “Storytelling With Data: A Data Visualization Guide for Business Professionals” by Cole Nussbaumer Knaflic.
Visualizing data in charts, graphs, dashboards, and infographics is one of the most powerful strategies for getting your numbers out of your spreadsheets and into real-world conversations. But it can be overwhelming to get started with data visualization. If so, this step-by-step data visualization guide is for you!
Tracking the success metrics based on your needs, and the time frame you select while comparing your values can be done with simple yet effective scorecards. A KPI scorecard is a term used to describe a statistical record that measures progress or achievement towards a set performance indicator. Let’s see this through a visual example.
2) Charts And Graphs Categories 3) 20 Different Types Of Graphs And Charts 4) How To Choose The Right Chart Type Data and statistics are all around us. That said, there is still a lack of charting literacy due to the wide range of visuals available to us and the misuse of statistics. Let’s dive into them.
In addition, they can use statistical methods, algorithms and machine learning to more easily establish correlations and patterns, and thus make predictions about future developments and scenarios. A central measure here is the definition and visualization of control and monitoring key figures.
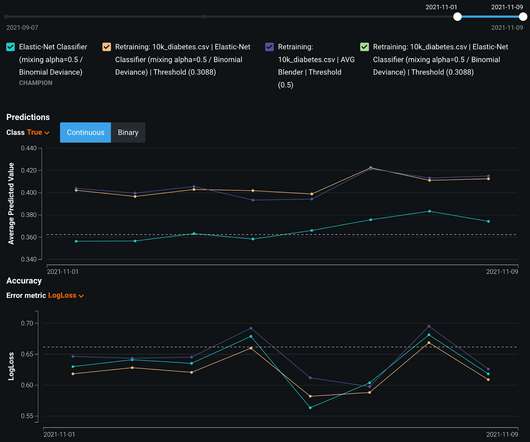
This also shows how the models compare on standard performance metrics and informative visualizations like Dual Lift. With DataRobot AI Cloud, you can see predicted values and accuracy for various metrics for the Champion as well as any Challenger models.]. Model Observability with Custom Metrics.
Partial dependence, accumulated local effect (ALE), and individual conditional expectation (ICE) plots : this involves systematically visualizing the effects of changing one or more variables in your model. There are a ton of packages for these techniques: ALEPlot , DALEX , ICEbox , iml , and pdp in R; and PDPbox and PyCEbox in Python.
That doesn’t stop people from finding ways to overcomplicate their data visualizations. The table is the best option for comparing multiple metrics with different scales. Showing this as a bar chart would make it look like the fouls is far more important than any other game statistic. It is called a Radial Bar Chart.
2) Pros & Cons Of Bar Charts 3) When To Use A Bar Graph 4) Types Of Bar Charts 5) Bar Graphs & Charts Best Practices 6) Bar Chart Examples In today’s fast-paced analytical landscape, data visualization has become one of the most powerful tools organizations can benefit from to be successful with their analytical efforts.
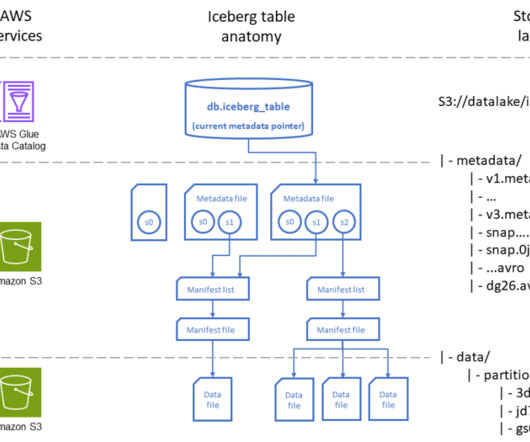
You will learn about an open-source solution that can collect important metrics from the Iceberg metadata layer. Based on collected metrics, we will provide recommendations on how to improve the efficiency of Iceberg tables. Key features This solution uses an AWS Lambda deployment package to collect metrics from Apache Iceberg tables.
Reporting and Data Visualization Improves Team Understanding! Statistics reveal that many people learn best when they see a story or information depicted in an image. According to Forbes, ‘Almost eighty-thousand scientific studies attest that visual images promote retention.’
Business and Market Requirements As organizations and business users embrace analytics, the need for new types of visualization, reporting and features changes quickly. Vendors can accommodate business-specific needs and data visualization requirements without time-consuming, expensive customization.
A CTO dashboard is a critical tool in the process of evaluating, monitoring, and analyzing crucial high-level IT metrics such as support expenses or critical bugs, e.g., with the goal to create a centralized and dynamic point of access for all relevant IT data. Besides, these dashboards can also be used as CTO reports. click to enlarge**.
There is a near infinite variety of visualization methods within our field. FlowingData has given us 9 ways to visualize proportions and 11 ways for changes over time. Strip plots in the flesh: NPR looks at school funding The LA Times on pop music’s evolution Eurostat’s key European statistics Jittered Strip Plot.
DataBrew is a visual data preparation tool that enables you to clean and normalize data without writing any code. The over 200 transformations it provides are now available to be used in an AWS Glue Studio visual job. Create a visual ETL job in AWS Glue Studio Next, you create the job that uses the recipe.
and metrics (follows, likes, reach, growth, awareness, post performance, engagements, etc.) Social media marketing reporting is based on a curated collection of data and statistics that are customized based on your business’s social marketing activities and goals. Choose the right metrics. over various time frames.
A content dashboard is an analytical tool that contains critical performance metrics to assess the success of all content-related initiatives. Modern dashboard software provides you with the necessary tools to visualize all your most important sources of information in a centralized location. Which we present below.
We organize all of the trending information in your field so you don't have to. Join 42,000+ users and stay up to date on the latest articles your peers are reading.
You know about us, now we want to get to know you!
Let's personalize your content
Let's get even more personalized
We recognize your account from another site in our network, please click 'Send Email' below to continue with verifying your account and setting a password.
Let's personalize your content