This site uses cookies to improve your experience. To help us insure we adhere to various privacy regulations, please select your country/region of residence. If you do not select a country, we will assume you are from the United States. Select your Cookie Settings or view our Privacy Policy and Terms of Use.
Cookie Settings
Cookies and similar technologies are used on this website for proper function of the website, for tracking performance analytics and for marketing purposes. We and some of our third-party providers may use cookie data for various purposes. Please review the cookie settings below and choose your preference.
Used for the proper function of the website
Used for monitoring website traffic and interactions
Cookie Settings
Cookies and similar technologies are used on this website for proper function of the website, for tracking performance analytics and for marketing purposes. We and some of our third-party providers may use cookie data for various purposes. Please review the cookie settings below and choose your preference.
Strictly Necessary: Used for the proper function of the website
Performance/Analytics: Used for monitoring website traffic and interactions
The terms “reporting” and “analytics” are often used interchangeably. In fact there are some very important differences between the two, and understanding those distinctions can go a long way toward helping your organization make best use of both financial reporting and analytics. Financial Reporting.
Fusion Data Intelligence, which is an updated avatar of Fusion Analytics Warehouse, combines enterprise data, and ready-to-use analytics along with prebuilt AI and machine learning models to deliver business intelligence.
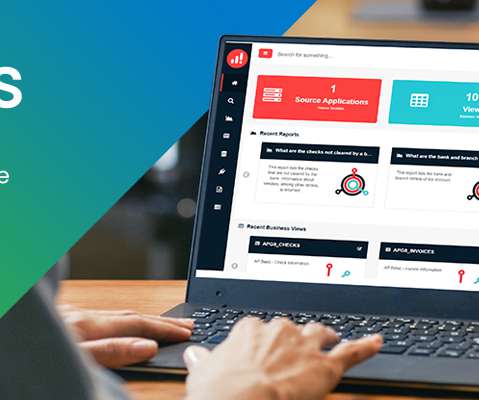
Dashboards often are the best way to gain insight into an organization and its various departments, operations and performance. Well-built, focused dashboards easily serve up summaries and reports of the BI that’s most critical to the organization. It is important to remember that dashboards are not just reports.
Reporting will change in D365 F&SCM, and those changes could significantly increase complexity and total cost of ownership. Now, instead of making a direct SQL call to the database to get information, a report must query a kind of intermediary layer instead. That works reasonably well for traditional reporting functions.
Companies are awash with information, each different department has their own KPIs and methods of reporting. They need integrated financial insights on accounting and finances data, better traceability and operationalreporting on things such as customer segmentation, products and revenue assurance.
If your business is running Microsoft Dynamics 365 Business Central (D365 BC) , or if you are planning to do so in the near future, then you are probably hearing a lot about Power BI as Microsoft’s preferred reporting and analytics platform for the company’s business applications. That provided a natural layer of security and privacy.
To succeed with real-time AI, data ecosystems need to excel at handling fast-moving streams of events, operational data, and machine learning models to leverage insights and automate decision-making. It’s clear how these real-time data sources generate data streams that need new data and ML models for accurate decisions.
Capacity monitoring dashboards As part of our platform management process, we conduct monthly operational reviews to maintain optimal performance. This involves analyzing an automated operationalreport that covers all the systems on the platform.
Consultants and developers familiar with the AX data model could query the database using any number of different tools, including a myriad of different report writers. The SQL query language used to extract data for reporting could also potentially be used to insert, update, or delete records from the database.
With its unique governance model, the Client business can fully serve its vocation with a long-term vision and fulfil its commitment to therapeutic progress and to serving patient needs. Key Benefits and Deliverables: Real-time report for Stocks, Sales, Returns, Regions etc., Download the Case study
July 21, 2022 – insightsoftware , a global provider of reporting, analytics, and performance management solutions, today launched its annual Finance Team Trends Report. With 63 percent of finance teams now reporting a “high level” of digitization, they have become significantly more efficient in their day-to-day tasks.
On-Prem Key Challenges For finance and operations teams that work at organizations choosing to stay on-prem, there are a couple of key challenges: Complex customization: Customizing Oracle EBS for financial and operationalreporting can be a complex and time-consuming process. It has saved his team hours of repetitive work.
While JD Edwards transactional data is required to run period close reports, analyze trends, and prepare forecasts for planning and budgeting, it comes with a lot of complexity. Ready to Navigate Financial Reporting in JD Edwards with Ease? 1 – What are all your reporting needs? . Each table can be huge. View Whitepaper Now.
Microsoft is deploying its cloud-ERP products with a more flexible licensing model than its legacy on-premise ERP software. Another major project that you can perform in advance involves an overhaul of reporting tools, processes, and designs. In this respect, reporting is the Achilles’ heel in Microsoft’s cloud-ERP migration strategy.
Integrated security model . Figure 1: CDE containerized service for operational management of spark workloads. With Virtual Cluster CDE can support multiple tenants and LoB, by providing strong isolation and per tenant compute quotas for cost management and chargeback models.
Angles for Oracle simplifies the process of accessing data from Oracle ERPs for reporting and analytical insights; offering seamless integration with cloud data warehouse targets. This release cements insightsoftware’s leadership in the reporting space for Oracle and is a highly attractive upgrade opportunity for existing customers.”.
Angles for Oracle simplifies the process of accessing data from Oracle ERPs for reporting and analytical insights; offering seamless integration with cloud data warehouse targets. This release cements insightsoftware’s leadership in the reporting space for Oracle and is a highly attractive upgrade opportunity for existing customers.”.
As proponents of Lean Thinking, we view corporations as data factories that produce information for operations, reporting, and financial modeling. We treat data as inventory, data management as manufacturing, and business output as finished goods. Anything […].
Over the last few decades, we’ve seen at least three distinct generations of BI technologies introduced to the market: First Generation Products like Crystal Reports, Brio, ProClarity and Siebel Analytics primarily offered thick-client reporting solutions to replace the historically manual production of “paper reports” ubiquitous in every company.
Ad hoc exploration and scheduled reports. Data Model. Small or medium sized models; dimensional and denormalized mainly, occasionally more normalized model. alert when threshold exceeded over a rolling window of statistics on the data, score the event data against a predictive model to decide which action to take next).
For more than 10 years, the publisher has used IBM Cognos Analytics to wrangle its internal and external operationalreporting needs. And in the last few years, the team realized there was an opportunity to expand beyond centralized operationalreporting to enable further business growth.
The data products used inside the company include insights from user journeys, operationalreports, and marketing campaign results, among others. It took up to 3 hours to generate daily reporting, which impacted business decision-making when re-calculations needed to happen during the day.
Adopting a new SaaS model, Jet Analytics Cloud is delivered via Microsoft Azure to provide a seamless and enhanced user experience. December 12, 2022— insightsoftware , a global provider of reporting, analytics, and performance management solutions, today announced the release of Jet Analytics Cloud. Raleigh, N.C.,
Logi Analytics and Izenda’s combined portfolio of low-code embedded analytics development enables software teams to efficiently deliver powerful visualizations, dashboards and reporting within their applications. insightsoftware is a leading provider of financial reporting and enterprise performance management software.
Small queries are part of many common use cases: Financial summary reporting with the end of quarter or end of year results. Data science experiment result and performance analysis, for example, calculating model lift. For this reason, Impala also implements a streaming pipelined execution model.
Hospitals and health systems are facing a critical challenge to both operations and overall business models. Issues involve everything from operating margins to revenue collection to reimbursement for treating patients with the virus.
The beginning starts with reporting automation (in a bid to make productivity gains at month-end close and to compress planning cycles). Automation impacts reporting. Or, they can see the impact of a journal entry they post reflected immediately in their reports. The transition will be gradual, as AI is only part of the story.
Integrated solution Spreadsheet Server – MRI Edition delivers automated financial and operationalreporting and live business insights for real estate customers. insightsoftware’s financial reporting solutions are easy to install, use, analyze, and trust. RALEIGH, N.C. Abo ut insightsoftware. About MRI Software.
Chapter 1 Which Analysis and Reporting Tools Do You Need? Chapter 5 Choosing the Right Business Intelligence Semantic Model. Chapter 7 Developing a Flexible and Scalable Tabular Model. Chapter 8 Developing a Flexible and Scalable Multidimensional Model. Part III Business Intelligence for Reporting.
Chapter 1 Which Analysis and Reporting Tools Do You Need? Chapter 5 Choosing the Right Business Intelligence Semantic Model. Chapter 7 Developing a Flexible and Scalable Tabular Model. Chapter 8 Developing a Flexible and Scalable Multidimensional Model. Part III Business Intelligence for Reporting.
Data Modelling Patterns 101 using Power Pivot. Tips and Tricks on Charts and Data Models. Publishing and Administering Dashboards and Reports in Power BI for the Organisation. Data Modelling Patterns 101 Using Power Pivot. Tips and Tricks on Charts and Data Models. Power Query 101 (for Power BI Dashboard).
Data Modelling Patterns 101 using Power Pivot. Tips and Tricks on Charts and Data Models. Publishing and Administering Dashboards and Reports in Power BI for the Organisation. Data Modelling Patterns 101 Using Power Pivot. Tips and Tricks on Charts and Data Models. Power Query 101 (for Power BI Dashboard).
Data Modelling Patterns 101 using Power Pivot. Tips and Tricks on Charts and Data Models. Publishing and Administering Dashboards and Reports in Power BI for the Organisation. Data Modelling Patterns 101 Using Power Pivot. Tips and Tricks on Charts and Data Models. Power Query 101 (for Power BI Dashboard).
Data Modelling Patterns 101 using Power Pivot. Tips and Tricks on Charts and Data Models. Publishing and Administering Dashboards and Reports in Power BI for the Organisation. Data Modelling Patterns 101 Using Power Pivot. Tips and Tricks on Charts and Data Models. Power Query 101 (for Power BI Dashboard).
The platform then automatically finds, visualizes and narrates important findings or the story in the data such as correlations, exceptions, clusters, links and predictions that are relevant to them without requiring them to build models, or write algorithms. The user explores data via visualizations and natural language generated narration.
For the accounting department in particular, the ability to collect and collate information, analyze that data, and produce accurate financial and operationalreports quickly has never been more important. Millions of employees around the world have shifted to a remote work model. Automation Is the Answer.
Michael, politely, says in an email: "I have done web analytics for five years, I have mastered Omniture, WebTrends and Google Analytics, I provide analysis and not just reporting. Or atleast 40% of the time you are a true Analysis Ninja, even if 60% of the time you are a glorified Reporting Squirrel! Implementation God.
Though the software offers several advantages over previous versions, finance teams using Microsoft D365BC may experience some challenges in the areas of operational and financial reporting. One general Microsoft D365BC reporting challenge comes from the ERP’s complex data table structure.
How do you ensure greater efficiency and accuracy for your financial reports? Here are five ways you can improve finance reporting efficiency, backed by our recent research into Oracle-driven finance teams. Embrace Finance Automation Oracle-driven finance teams contend with a wide range of automated financial reporting needs.
If you’re relying on JasperReports or Crystal Reports to power your data reporting and insights, you’ve likely heard the news: many popular versions are reaching end-of-life, and it’s time to start planning your next steps. If you’re a Crystal Reports user, the situation is just as pressing.
Enter operationalreporting, the change agent in our story. In the past year alone, a staggering 66% of IT decision-makers have witnessed a surge in requests for operationalreports. Recent findings highlight the increasing importance of operationalreporting and the significant impact it has on organizations.
Operationalreporting is an effective, results-driven means of tracking, measuring, and analyzing your business’s regular deliverables and metrics. These dynamic reports offer invaluable insights into various logistical aspects relating to your organization’s activities across the board. The Right Pairing. Download Now.
As Business Intelligence (BI) tools, data warehousing solutions, and enterprise data and application landscapes have advanced, it’s worth taking the time to rethink that old model, starting with the dichotomy between operationalreporting (OR) and strategic analytics. with their current operationalreporting tools, with?
The need to create consolidated reporting and analytics that handle all your Oracle ERP instances is a challenge your enterprise faces in many circumstances, but none as important as during cloud migration. Enhance Your OperationalReporting Needs with Angles for Oracle. Does This Challenge Sound Familiar? Access Resource.
We organize all of the trending information in your field so you don't have to. Join 42,000+ users and stay up to date on the latest articles your peers are reading.
You know about us, now we want to get to know you!
Let's personalize your content
Let's get even more personalized
We recognize your account from another site in our network, please click 'Send Email' below to continue with verifying your account and setting a password.


Let's personalize your content