This site uses cookies to improve your experience. To help us insure we adhere to various privacy regulations, please select your country/region of residence. If you do not select a country, we will assume you are from the United States. Select your Cookie Settings or view our Privacy Policy and Terms of Use.
Cookie Settings
Cookies and similar technologies are used on this website for proper function of the website, for tracking performance analytics and for marketing purposes. We and some of our third-party providers may use cookie data for various purposes. Please review the cookie settings below and choose your preference.
Used for the proper function of the website
Used for monitoring website traffic and interactions
Cookie Settings
Cookies and similar technologies are used on this website for proper function of the website, for tracking performance analytics and for marketing purposes. We and some of our third-party providers may use cookie data for various purposes. Please review the cookie settings below and choose your preference.
Strictly Necessary: Used for the proper function of the website
Performance/Analytics: Used for monitoring website traffic and interactions
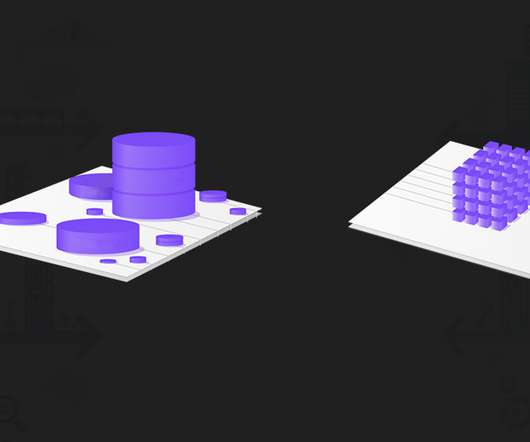
DuckDB is a free, open-source, in-process OLAP database built for fast, local analytics. As an OLAP system, DuckDB stores data in columns (not rows like OLTP systems), making it highly efficient for analytical queries such as joins, aggregations, and groupings. Let’s dive in! What Is DuckDB? What Are DuckDB’s Main Features?
On the other, the strategic brains: the online analytical processing (OLAP) platforms that sift through historical data to support planning and strategy. On one side stood the digital engine of the company: the online transaction processing (OLTP) systems that manage inventory in real-time.
Architectural capabilities that support low-latency, agentic AI systems Technology capability What it does Why it matters Streaming data platform Continuously processes data as it’s generated Enables immediate response to business events Event-driven architecture Automatically triggers actions based on real-time signals Powers dynamic, automated decision (..)
Overview OLTP and OLAP are 2 data processing capabilities Understand the difference between OLTP and OLAP Introduction You acquire new information every day. The post Data Engineering for Beginners – Difference Between OLTP and OLAP appeared first on Analytics Vidhya.
Introduction In the field of Data Science main types of online processing systems are Online Transaction Processing (OLTP) and Online Analytical Processing (OLAP), which are used in most companies for transaction-oriented applications and analytical work. In the Database Management System, both OLAP and OLTP play […].
One of the most valuable tools available is OLAP. Using OLAP Tools Properly. Trend analysis, financial reporting, and sales forecasting are frequently aided by OLAP business intelligence queries. ( Several or more cubes are used to separate OLAP databases. OLAP’s disadvantages. see more ).
Apache Pinot, an open-source OLAP datastore, offers the ability to handle real-time data ingestion and low-latency querying, making it […] The post Real-Time App Performance Monitoring with Apache Pinot appeared first on Analytics Vidhya.
In this blog post, we’ll look at the definition of OLAP as well as an overview of the technology. We explain what lies behind OLAP, what cubes have to do with it and what makes the technology so powerful for modern planning, budgeting, and forecasting. Most modern EPM solutions rely on multidimensional OLAP, also called MOLAP.
Introduction DuckDB is designed to support analytical query workloads, also known as Online analytical processing (OLAP).” This article was published as a part of the Data Science Blogathon. In short, […].
This is how the Online Analytical Processing (OLAP) cube was born, which you might call one of the grooviest BI inventions developed in the 70s. OLAP cube is designed as a solution to pre-compute totals and subtotals when the database server is idle. The OLAP cube makes reading data across multiple dimensions manageable.
Online analytical processing (OLAP) database systems and artificial intelligence (AI) complement each other and can help enhance data analysis and decision-making when used in tandem. As AI techniques continue to evolve, innovative applications in the OLAP domain are anticipated.
Solution overview Online Analytical Processing (OLAP) is an effective tool for today’s data and business analysts. An analyst can use OLAP aggregations to analyze buying patterns by grouping customers by demographic, geographic, and psychographic data, and then summarizing the data to look for trends.
PARIS Tech and partner David Newton from Newton Carmen have collaborated to create an OLAP model for analysing the 2023 Rugby World Cup. Using this data model, full of every Rubgy stat imaginable, we’ve run a video series of over20 different scenarios. Turns out we were able to predict the South African winners!
Online Analytical Processing (OLAP) is crucial in modern data-driven apps, acting as an abstraction layer connecting raw data to users for efficient analysis. OLAP combines data from various data sources and aggregates and groups them as business terms and KPIs.
The post Dreamkillers – Analyzing the 2023 Rugby World Cup with OLAP Cube Technology first appeared on PARIS Tech. We’ve created a Rugby World Cup model with an array of versions, predicting diverse outcomes for matches at different stages of the event.
OLTP vs OLAP. First, we’ll dive into the two types of databases: OLAP (Online Analytical Processing) and OLTP (Online Transaction Processing). An OLAP database is best for situations where you read from the database more often than you write to it. OLAP databases excel at queries that require large table scans (e.g.
For more powerful, multidimensional OLAP-style reporting, however, it falls short. OLAP reporting has traditionally relied on a data warehouse. OLAP reporting based on a data warehouse model is a well-proven solution for companies with robust reporting requirements.
Pentaho from Hitachi Vantara offers a suite of open source business intelligence(BI) products that help IT and business users to do data integration, OLAP services, reporting, dashboarding, data mining and ETL capabilities. Pentaho Community Edition .
Multi-dimensional analysis is sometimes referred to as “OLAP”, which stands for “online analytical processing.” Technically speaking, OLAP refers to methodologies for producing multidimensional analysis on high-volume data sets.). That may prompt further investigation and could reveal insights as to the appropriate corrective action.
From what I can remember, in-memory analytics, mobile BI, OLAP cubes and easier to use drag-and-drop analytics tools got all the buzz. by Jen Underwood. What was hot and what was not? Read More.
Online analytical processing (OLAP), which enabled users to quickly and easily view data along different dimensions, was coming of age. The challenge with OLAP, however, is that it requires intensive processing power to aggregate data according to various categories or dimensions. Data warehouses have been in widespread use for years.
Model-based analysis like OLAP analysis on cubes or ad hoc analysis based on semantic models provides greater flexibility for end users to pull information out of their information landscape. Standard or enterprise reporting is used in almost every company (95 percent, see Figure 1) leaving little room for improvement.
As a result, they continue to expand their use cases to include ETL, data science , data exploration, online analytical processing (OLAP), data lake analytics and federated queries. Uber chose Presto for the flexibility it provides with compute separated from data storage.
The optimized data warehouse isn’t simply a number of relational databases cobbled together, however—it’s built on modern data storage structures such as the Online Analytical Processing (or OLAP) cubes. Cubes are multi-dimensional datasets that are optimized for analytical processing applications such as AI or BI solutions.
The software selection service SelectHub breaks down some of the most important categories and features : Dashboards Visualizations Reporting Data mining ETL (extract-transfer-load — tools that import data from one data store into another) OLAP (online analytical processing) Of these tools, dashboards and visualization are by far the most popular; (..)
The former is more professional in report making, presentation, and printing, while the latter can make OLAP and predict analysis thanks to the BI capabilities. As reporting software, it does not support OLAP. The other is working as the reporting capability of BI tools, which is usually called BI reporting. FineReport.
The OLAP.com blog recently published an article discussing the use of OLAP cube technology in analyzing and predicting outcomes for the 2023 Rugby World Cup. Cube technology or “OLAP” is a multi-dimensional database commonly used in Finance and Accounting for analysis, though it
They generally leverage simple statistical and analytical tools, but Power notes that some OLAP systems that allow complex analysis of data may be classified as hybrid DSS systems. These DSS include systems that use accounting and financial models, representational models, and optimization models.
Technicals such as data warehouse, online analytical processing (OLAP) tools, and data mining are often binding. On the opposite, it is more of a comprehensive application of data warehouse, OLAP, data mining, and so forth. Therefore, from a technical perspective, business intelligence solution is not about new things.
Jet Analytics is a business intelligence and reporting solution with pre-built data warehouse and OLAP cubes for Dynamics GP. Data Warehouse and OLAP Cubes. Management Reporter. Jet Analytics. Multi Data Source Consolidation. Dashboards and KPIs. Power Bi Integration. Advanced Security. Compare Management Reporter and Jet Reports.
Business intelligence (BI) software can help by combining online analytical processing (OLAP), location intelligence, enterprise reporting, and more. Store and manage: Next, businesses store and manage the data in a multidimensional database system, such as OLAP or tabular cubes.
The data analysis part is responsible for extracting data from the data warehouse, using the query, OLAP, data mining to analyze data, and forming the data conclusion with data visualization. The underlying data is in charge of data management, covering data collection, ETL, building a data warehouse, etc.
TIBCO Jaspersoft offers a complete BI suite that includes reporting, online analytical processing (OLAP), visual analytics , and data integration. Online Analytical Processing (OLAP). The web-scale platform enables users to share interactive dashboards and data from a single page with individuals across the enterprise. Ad Hoc Analysis.
Expanded our support of Microsoft OLAP cube , an innovative open-source feat. Announced our metadata management automated solution support across the entire Microsoft BI Stack. Named by Solutions Review as an Analytics Vendor to Watch, 2020. Named by CRN as a Top 10 Data Analytics Company to Watch.
In the 1990s, OLAP tools allowed multidimensional data analysis. Evolution of BI Tools and Technologies So, where did the story begin, and how did BI tools even come to exist ? Let’s break it down for you. The story goes back to the mid-20th century. Relational databases emerged in the 1970s, enabling more advanced data management.
The way to work around this shortcoming is to use OLAP cubes or data models generated within memory, but these will take time to develop and test, especially since they need to be scalable to the level of use in a data lake. The Third Problem – Preparation of Data.
At PARIS, you may have noticed that recently, we’ve added a touch of fun concerning “version maintenance” as a business idea by intertwining it with—of all things!—Rugby Rugby World Cup data. Now, in the context of the Rugby World Cup—which event is coming up quickly—the notion of version maintenance may seem unconventional, yet we believe that
Therefore, the real magic happens when OLAP cubes are built or delivered from the data warehouse. OLAP cubes do all the work by dimensionalizing all combinations of slicing and dicing the data ahead of time.
Jet Analytics provides a pre-built data warehouse , OLAP cubes , and tabular models with a platform for non-technical users to easily create their own reports in Excel or Power BI. With a short time to value, you can be up and running in an hour and seeing tangible benefits before the end of your next reporting cycle.
Thanks to The OLAP Report for lots of great market materials. Comshare, Pilot, Metaphor, watch out here comes some more: OLAP, ROLAP, HOLAP, MOLAP now my head hurts. OLAP for the masses, gents? OLAP Services, TM1, Pablo, Wired, and Crystal fun. Showcase, SQRIBE all get imbibed and don’t forget OLAP@ Work.
If you have advanced requirements for OLAP analysis or prediction, the BI suite is a better choice. . In conclusion, if you only need to do data display, reporting, and basic data analysis, a bi reporting tool is enough to satisfy your demands. How does BI Reporting Work?
OLAP Cubes vs. Tabular Models. The first is an OLAP model. To perform multidimensional analysis on large data sets, OLAP data were organized into “cubes.” Most organizations are looking for sophisticated reporting and analytics, but they have little appetite for managing the highly complicated infrastructure that goes with it.
We organize all of the trending information in your field so you don't have to. Join 42,000+ users and stay up to date on the latest articles your peers are reading.
You know about us, now we want to get to know you!
Let's personalize your content
Let's get even more personalized
We recognize your account from another site in our network, please click 'Send Email' below to continue with verifying your account and setting a password.


Let's personalize your content