This site uses cookies to improve your experience. To help us insure we adhere to various privacy regulations, please select your country/region of residence. If you do not select a country, we will assume you are from the United States. Select your Cookie Settings or view our Privacy Policy and Terms of Use.
Cookie Settings
Cookies and similar technologies are used on this website for proper function of the website, for tracking performance analytics and for marketing purposes. We and some of our third-party providers may use cookie data for various purposes. Please review the cookie settings below and choose your preference.
Used for the proper function of the website
Used for monitoring website traffic and interactions
Cookie Settings
Cookies and similar technologies are used on this website for proper function of the website, for tracking performance analytics and for marketing purposes. We and some of our third-party providers may use cookie data for various purposes. Please review the cookie settings below and choose your preference.
Strictly Necessary: Used for the proper function of the website
Performance/Analytics: Used for monitoring website traffic and interactions
To squeeze every last drop of value from your data, both in an operational and strategic sense, it’s important to leverage the right online reporting tool. When it comes to reporting, the daily running of your business, the plans and methods you formulate to improve the organization will steer your long-term success.
1) What Is A Weekly Report? 2) Why Are Weekly Progress Reports Important? 3) Weekly Report Templates & Examples. 4) Top Elements Of A Weekly Performance Report. This is where interactive weekly reports come into the picture. Your Chance: Want to build great weekly status reports on your own?
Before we even realize our business potentials and want to act in our competitive market, there is always a new business plan to make, a new strategy to develop, a new report to generate – and they all take time. Your Chance: Want to test a professional reporting automation software? What Is An Automated Report?
Table of Contents 1) What Is The Report Definition? 2) Top 14 Types Of Reports 3) What Does A Report Look Like? Businesses have been producing reports since, forever. This presents a problem for many modern organizations today as building reports can take from hours to days. What Is The Report Definition?
Small queries are part of many common use cases: Financial summary reporting with the end of quarter or end of year results. Operational, Cybersecurity, and IoT reporting where the current point in time state of an individual or single device needs to be analyzed. . Impala Optimizations for Small Queries.
Operationalreports have the potential to greatly enhance business performance through the utilization of data-driven insights. These reports offer a structured and comprehensible representation of data, enabling a clearer understanding of complex issues that might otherwise remain elusive. What Is An OperationalReport?
April 11, 2022— insightsoftware , a global provider of reporting, analytics, and performance management solutions that drive greater financial intelligence, today expanded the Angles product line , with the launch of new solutions for no-code operationalreporting for NetSuite and Deltek. RALEIGH, N.C.
Financial reporting requires a significant amount of time, attention, and input to prepare reports that offer valuable analysis and deep insight into enterprise performance. Rather, these issues are evidence of a financial reporting process that’s producing untrustworthy information and eating extra time along the way.
Recognizing a need for better operational analytics, insightsoftware leveraged award-winning technology from Logi Analytics to provide Oracle ERP Cloud users the ability to customize, create, and share interactive dashboards and reports across all departments of a business.
As the use of Hydro grows within REA, it’s crucial to perform capacity planning to meet user demands while maintaining optimal performance and cost-efficiency. Capacity monitoring dashboards As part of our platform management process, we conduct monthly operational reviews to maintain optimal performance.
Dashboards often are the best way to gain insight into an organization and its various departments, operations and performance. Well-built, focused dashboards easily serve up summaries and reports of the BI that’s most critical to the organization. It is important to remember that dashboards are not just reports.
The out-of-the-box reporting provided by big ERP vendors frequently fails to address the fundamental requirements of speed and agility, making it difficult for finance and accounting to achieve that vision for up-to-date financial intelligence to support time-critical processes. Limitations of the Oracle ERP Cloud Reporting Tools.
The application supports custom workflows to allow demand and supply planning teams to collaborate, plan, source, and fulfill customer orders, then track fulfillment metrics via persona-based operational and management reports and dashboards.
It’s ironic that many of those same businesses fail to devote the necessary time and energy to optimizing working capital. A good ERP system can go a long way toward optimizing inventory management with accurate demand forecasting, effective control over quantities and locations, and improved processes for managing inventory.
One form of an operationalreport is a pixel-perfect operationalreport. Pixel-perfect reports are optimal for high-precision reporting. What is Pixel-perfect Reporting? To illustrate another example in which accurate reporting at scale is essential , think of the healthcare industry.
To fulfil these needs, you need direct access to accurate data from your ERP, and the ability to quickly create drillable Excel reports for GL and other finance requirements. To customize an existing report or to create a new one with Crystal Reports, you need technical expertise.
As organizations shift from on-premise to cloud-based systems, they need solutions that simplify the transition and optimize data use with ease. Spreadsheet Server with Infor M3 Cloud Connector delivers a better, more familiar reporting experience for finance teams using Infor M3 Cloud, or those migrating to M3 Cloud.
For example, NetSuite makes it possible to generate reports on enterprise performance, but it doesn’t necessarily optimize the reporting process. It offers a suite of financial and operationalreporting tools that run inside the familiar ecosystem of Excel and fully integrate with NetSuite.
In the world of finance and accounting, CFOs are discovering the merits of finance-owned reporting tools. These real-time reporting tools are ideally suited for remote work. Here are some tips for making optimal use of real-time reporting tools in a remote work environment. Do Away with Static Reporting.
If you’re stumbling across this post through the sea of results researching “business intelligence vs. reporting,” then maybe you’re already familiar with the unlimited interpretations and definitions of these two practices. How to Compare Reporting & BI Solutions. in “business intelligence vs. reporting” is a bit misleading.
Having quick access to cost data from other systems—including employee productivity systems, ERP systems, custom designed GLs, and custom entities—can give you a significant boost in both efficiency and accuracy in reporting. How Financial Reporting Can Help. How Data Access Facilitates KPI Reporting. Debt to equity ratio.
Consequently, most of them require businesses to provide regular financial reporting and updates concerning their performance relative to those debt agreements. Even worse, your creditors may be entitled to demand repayment in full, leaving your company without the cash it needs to operate. What is a Debt Covenant Report?
The data products used inside the company include insights from user journeys, operationalreports, and marketing campaign results, among others. It took up to 3 hours to generate daily reporting, which impacted business decision-making when re-calculations needed to happen during the day.
Deal furthers mission to deliver powerful portfolio of enterprise software solutions for Office of the CFO; expands real-time financial reporting capabilities for top ERPs Sage and Viewpoint. Emphasis on accurate financial and operationalreporting in order to maintain cash flow is more important than ever. RALEIGH, N.C.
Deal furthers company’s strategy to digitally transform the Office of the CFO; expands market-leading capabilities in financial reporting, consolidation, budgeting and planning, and adds tax reporting. RALEIGH, N.C. The company supports more than 100,000 users at 700 enterprise customers in more than 100 countries.
Poll of nearly 500 financial professionals reveals misguided assumptions about cloud ERP reporting and lack of visibility into cloud ERP adoption. The survey examined perceptions about the impact of cloud-based ERPs on the financial reporting process, and assessed the readiness of respondents’ organizations to adopt cloud ERPs.
Consultants and developers familiar with the AX data model could query the database using any number of different tools, including a myriad of different report writers. The SQL query language used to extract data for reporting could also potentially be used to insert, update, or delete records from the database.
On-Prem Key Challenges For finance and operations teams that work at organizations choosing to stay on-prem, there are a couple of key challenges: Complex customization: Customizing Oracle EBS for financial and operationalreporting can be a complex and time-consuming process. It has saved his team hours of repetitive work.
Ad hoc exploration and scheduled reports. the time it takes for the data to be optimally queryable is faster – query immediately upon arrival with no need for processing or aggregation or compaction. Optimized for insert only as well as insert+update patterns. Optimized for point lookups, analytics, mutations, etc.
By taking the time to understand the detailed parameters that define functional access to the system for each user type, companies can choose a licensing plan that best suits their needs, optimizing costs in the process. Another major project that you can perform in advance involves an overhaul of reporting tools, processes, and designs.
This connector provides comprehensive access to SFTP storage, facilitating cloud ETL processes for operationalreporting, backup and disaster recovery, data governance, and more. Solution overview In this example, you use AWS Glue Studio to connect to an SFTP server, then enrich that data and upload it to Amazon S3.
Figure 1: CDE containerized service for operational management of spark workloads. As Spark jobs are deployed by Modak Nabu they are efficiently scheduled and executed on CDE’s autoscaling service that’s optimized for kubernetes.
report they have established a data culture 26.5% report they have a data-driven organization 39.7% report they are managing data as a business asset 47.4% An enterprise data ecosystem architected to optimize data flowing in both directions.
. – September 10, 2020 – insightsoftware, a global provider of enterprise software solutions for the Office of the CFO, today announced it has acquired Viareport , a financial software provider that delivers cloud-based financial consolidation, lease accounting, reporting, and forecasting solutions. Terms of the deal were not disclosed.
Multinational corporations operating in the DACH regionGermany, Austria, and Switzerlandare navigating an increasingly volatile trade landscape, where precise financial reporting is both a necessity and a challenge. Swiss businesses can align with FER standards while maintaining transparency in cross-border operations.
According to the SAP edition of insightsoftware and Hanover Researchs latest Finance Team Trends Report , 96% of SAP-driven finance teams use multiple software tools from different software vendors. Angles for SAP streamlines and improves operationalreporting.
The introduction of post-Brexit trade rules, increasing tariff impact, and the pressure to meet ESG reporting obligations make financial reporting not just a back-office taskbut a core strategic function. Errors in reporting or delays in submission can lead to heavy penalties, reputational damage, and missed investment opportunities.
These changes have introduced a higher level of complexity to financial reporting and disclosure practices, particularly for organizations engaged in cross-border trade with the EU and beyond. Challenges for the UK and Ireland The post-Brexit era has introduced unique reporting pressures for finance teams across the UK and Ireland.
For financial professionals, this isnt just a logistics or procurement challengeits a high-stakes compliance and reporting minefield. Tariff-related costs must be forecasted, modeled, and accurately reflected in financial reports. Dont let tariff complexity derail your reporting strategy. It works within Microsoft Office.
Instead of trying to adapt to something new, these companies may plan to optimize what they already have. For example, a dedicated financial reporting tool makes it easy to extract data from the ERP in the form of tailor-made insights. Making Something Exceptional Out of On-Premises ERP.
Raleigh, N.C – August 4, 2022 – insightsoftware , a global provider of reporting, analytics, and performance management solutions, today announced the release of Logi Composer 7. Enhancements to visualizations to improve speed, visual optimization, and ease of use. API enhancements to streamline embedded workflow.
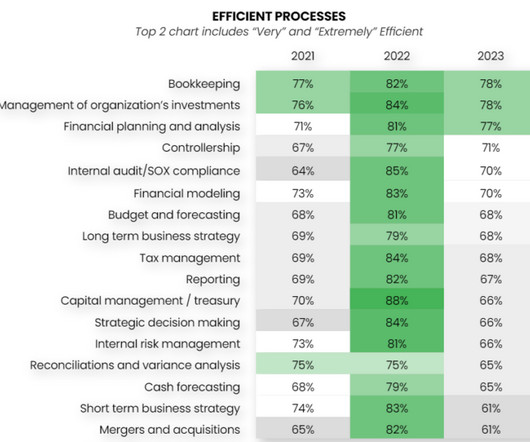
The results are in–for the third year in a row, insightsoftware has partnered with Hanover Research to deliver our yearly Finance Team Trends Report. External Market Challenges are Hampering Finance Teams In 2023, the impact of external factors is clear as the optimism from the previous year has been replaced by pragmatism and realism.
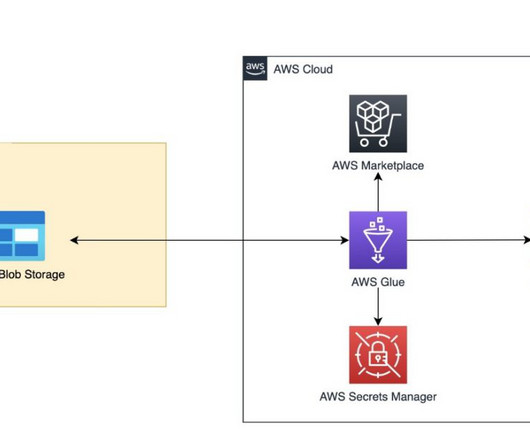
This connector provides access to Azure Blob Storage, facilitating cloud ETL processes for operationalreporting, backup and disaster recovery, data governance, and more. Conclusion In this post, we showed how to use AWS Glue and the new connector for ingesting data from Azure Blob Storage to Amazon S3. Learn more in README.
This connector provides access to Google Cloud Storage, facilitating cloud ETL processes for operationalreporting, backup and disaster recovery, data governance, and more. Conclusion In this post, we showed how to use AWS Glue and the new connector for ingesting data from Google Cloud Storage to Amazon S3.
We organize all of the trending information in your field so you don't have to. Join 42,000+ users and stay up to date on the latest articles your peers are reading.
You know about us, now we want to get to know you!
Let's personalize your content
Let's get even more personalized
We recognize your account from another site in our network, please click 'Send Email' below to continue with verifying your account and setting a password.


Let's personalize your content