This site uses cookies to improve your experience. To help us insure we adhere to various privacy regulations, please select your country/region of residence. If you do not select a country, we will assume you are from the United States. Select your Cookie Settings or view our Privacy Policy and Terms of Use.
Cookie Settings
Cookies and similar technologies are used on this website for proper function of the website, for tracking performance analytics and for marketing purposes. We and some of our third-party providers may use cookie data for various purposes. Please review the cookie settings below and choose your preference.
Used for the proper function of the website
Used for monitoring website traffic and interactions
Cookie Settings
Cookies and similar technologies are used on this website for proper function of the website, for tracking performance analytics and for marketing purposes. We and some of our third-party providers may use cookie data for various purposes. Please review the cookie settings below and choose your preference.
Strictly Necessary: Used for the proper function of the website
Performance/Analytics: Used for monitoring website traffic and interactions
Use PredictiveAnalytics for Fact-Based Decisions! To accomplish these goals, businesses are using predictive modeling and predictiveanalytics software and solutions to ensure dependable, confident decisions by leveraging data within and outside the walls of the organization and analyzing that data to predict outcomes in the future.
For example, at a company providing manufacturing technology services, the priority was predicting sales opportunities, while at a company that designs and manufactures automatic test equipment (ATE), it was developing a platform for equipment production automation that relied heavily on forecasting. You get the picture.
The demand for real-time online data analysis tools is increasing and the arrival of the IoT (Internet of Things) is also bringing an uncountable amount of data, which will promote the statistical analysis and management at the top of the priorities list. Industries harness predictiveanalytics in different ways.
‘Giving your team access to sophisticated, complex analytical techniques in an intuitive environment, allows them to leverage predictiveanalytics without a data scientist or analytical background.’ That’s why your business needs predictiveanalytics. And, not just any predictiveanalytics!
The chief aim of data analytics is to apply statistical analysis and technologies on data to find trends and solve problems. Data analytics has become increasingly important in the enterprise as a means for analyzing and shaping business processes and improving decision-making and business results.
What is business analytics? Business analytics is the practical application of statistical analysis and technologies on business data to identify and anticipate trends and predict business outcomes. What is the difference between business analytics and business intelligence? This is the purview of BI.
An analytics alternative that goes beyond descriptive analytics is called “PredictiveAnalytics.”. PredictiveAnalytics: Predicting Future Outcomes. While descriptive analytics are focused on historical performance, predictiveanalytics are about predicting future outcomes.
Team members who have access to augmented analytics and assisted predictive modeling can plan better, predict more accurately and dependably meet goals and objectives. Complete Set of Analytical Techniques. Hypothesis Testing. Descriptive Statistics. Access to Flexible, Intuitive Predictive Modeling.
All in all, the concept of big data is all about predictiveanalytics. What’s even more important, predictiveanalytics prevents accidents on the road. Predictiveanalytics takes care of both direct and indirect costs. So, without further ado, let’s see how it works in detail. Maintenance. Fuel Management.
More often than not, it involves the use of statistical modeling such as standard deviation, mean and median. Let’s quickly review the most common statistical terms: Mean: a mean represents a numerical average for a set of responses. Standard deviation: this is another statistical term commonly appearing in quantitative analysis.
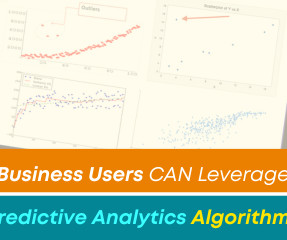
Give Your Team Assisted PredictiveAnalytics with Easy-to-Use Algorithms and Techniques! In order to get the most out of a self-serve analytical solution, your team members will leverage many types of tools. A comprehensive augmented analytics solution should include a full suite of assisted predictiveanalytics tools.
In addition, they can use statistical methods, algorithms and machine learning to more easily establish correlations and patterns, and thus make predictions about future developments and scenarios. If a database already exists, the available data must be tested and corrected.
Through a marriage of traditional statistics with fast-paced, code-first computer science doctrine and business acumen, data science teams can solve problems with more accuracy and precision than ever before, especially when combined with soft skills in creativity and communication. Math and Statistics Expertise.
They generally leverage simple statistical and analytical tools, but Power notes that some OLAP systems that allow complex analysis of data may be classified as hybrid DSS systems. Commonly used models include: Statistical models. They emphasize access to and manipulation of a model. TIBCO Spotfire.
. ‘Although companies in healthcare, IT and finance are some of the biggest investors in analytics technology, plenty of other sectors are investing in analytics as well. Analytics Becomes Major Asset to Companies Across All Sectors. The most significant benefit of statistical analysis is that it is completely impartial.
Data scientists are experts in applying computer science, mathematics, and statistics to building models. The US Bureau of Labor Statistics says there were 149,300 data architect jobs in the US in 2022 and projects the number of data architects will grow by 8% from 2022 to 2032. Are data architects in demand?
The US Bureau of Labor Statistics (BLS) forecasts employment of data scientists will grow 35% from 2022 to 2032, with about 17,000 openings projected on average each year. Candidates for the exam are tested on ML, AI solutions, NLP, computer vision, and predictiveanalytics.
This may require using tools such as Microsoft Excel or Google Sheets for fundamental statistical analysis or more advanced tools such as Tableau for visualizing complex datasets. Identify Areas of Improvement Once the data has been analyzed, identify areas where improvement is needed for processes to become more efficient or cost-effective.
What is PredictiveAnalytics and How Can it Help My Business? What is predictiveanalytics? Put simply, predictiveanalytics is a method used to forecast and predict the future results and needs of an organization using historical data and a comprehensive set of data from across and outside the enterprise.
Market Testing. For example, Chime Bank used artificial intelligence to test 216 versions of its homepage in just three months. The human resources department is in a unique position to help curb those statistics and ensure the workforce is strategically aligned with the cost factors of a business. Indirect Costs.
Organization: AWS Price: US$300 How to prepare: Amazon offers free exam guides, sample questions, practice tests, and digital training. The exam tests general knowledge of the platform and applies to multiple roles, including administrator, developer, data analyst, data engineer, data scientist, and system architect.
The second was about predictiveanalytics and how using massive integrations between online and offline databases they had accomplished some really cool reporting of data (and make no doubt the IT work done over 18 months to accomplish this was cool). 2 Learn basic statistics. Hello statistical significance ! #3
This article focuses on the Independent Samples T Test technique of Hypothesis testing. What is the Independent Samples T Test Method of Hypothesis Testing? Let’s look at a sample of the Independent t-test on two variables. How Can the Independent Samples T Test Method Benefit an Organization?
This article discusses the Paired Sample T Test method of hypothesis testing and analysis. What is the Paired Sample T Test? The Paired Sample T Test is used to determine whether the mean of a dependent variable e.g., weight, anxiety level, salary, reaction time, etc., is the same in two related groups.
This article describes chi square test of association and hypothesis testing. What is the Chi Square Test of Association Method of Hypothesis Testing? It is used to determine whether there is a statistically significant association between the two categorical variables. Use Case – 1.
Most commonly, we think of data as numbers that show information such as sales figures, marketing data, payroll totals, financial statistics, and other data that can be counted and measured objectively. All descriptive statistics can be calculated using quantitative data. Digging into quantitative data. This is quantitative data.
This article provides a brief explanation of the definition and uses of the Descriptive Statistics algorithms. What is a Descriptive Statistics? Descriptive statistics helps users to describe and understand the features of a specific dataset, by providing short summaries and a graphic depiction of the measured data.
In this article, we provide a list with links that will detail some of the many analytical techniques your business users will employ and provide examples of how these techniques can be used to solve problems and identify opportunities with clear, easy techniques and results. Paired Sample T Test. Chi Square Test.
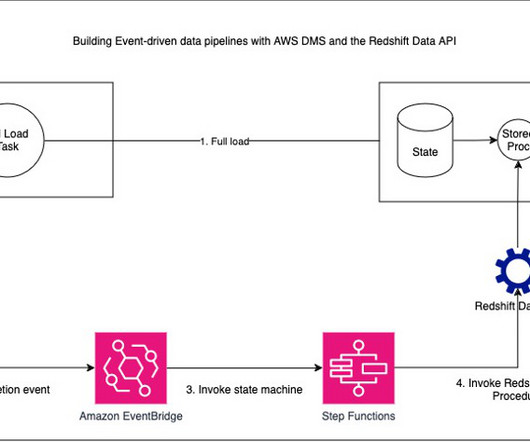
Tens of thousands of customers use Amazon Redshift to process exabytes of data per day and power analytics workloads such as BI, predictiveanalytics, and real-time streaming analytics. For Name , enter a name (for example, dms-test ). Test the solution Run the task and wait for the workload to complete.
Though you may encounter the terms “data science” and “data analytics” being used interchangeably in conversations or online, they refer to two distinctly different concepts. Data science is an area of expertise that combines many disciplines such as mathematics, computer science, software engineering and statistics.
Smarten CEO, Kartik Patel says, ‘The addition of PMML integration capability enables faster roll-out and allows users to leverage the Smarten workflow for PMML predictive models, adding more flexibility and power to the Smarten suite of augmented analytics tools.’
The Smarten approach to business intelligence and business analytics focuses on the business user and provides Advanced Data Discovery so users can perform early prototyping and test hypotheses without the skills of a data scientist.
Advanced Data Discovery allows business users to perform early prototyping and to test hypothesis without the skills of a data scientist, ETL or developer. Self-Serve Data Preparation provides seamless data access and allows users to discover, transform, mash-up and integrate data for clear analytics.
There are primarily two underlying techniques that can be leveraged for AML initiatives- Exploratory Data Analysis and Predictiveanalytics. PredictiveAnalytics It is a subset of business analytics that uses statistical techniques (algorithms) to find patterns in historical data points and predict future outcomes with high accuracy.
There are primarily two underlying techniques that can be leveraged for AML initiatives- Exploratory Data Analysis and Predictiveanalytics. PredictiveAnalytics. For predictiveanalytics to deliver high accuracy, a lot depends on the combination of domain knowledge and technical expertise.
Solution capabilities included self-serve data preparation , smart data visualization and predictiveanalytics for forecasting, etc. Augmented Analytics Explained : As self-serve augmented analytics began to evolve, new tools and techniques were added, and business users now enjoy the expanded capabilities of predictiveanalytics.
After completion of the testing procedure, the certificate is provided to show that all requirements were met. The Smarten approach to business intelligence and business analytics focuses on the business user and provides Advanced Data Discovery so users can perform early prototyping and test hypotheses without the skills of a data scientist.
If your data science resources are strained, here is an example data scientist workflow that leverages Birst to speed up tasks throughout the application development lifecycle – data preparation, model development and testing with R integration, deployment into the business, and governance and management.
With Amazon Redshift, you can build lake house architectures and perform any kind of analytics, such as interactive analytics , operational analytics , big data processing , visual data preparation , predictiveanalytics, machine learning , and more. When the test is successful, choose OK. Choose Test Task.
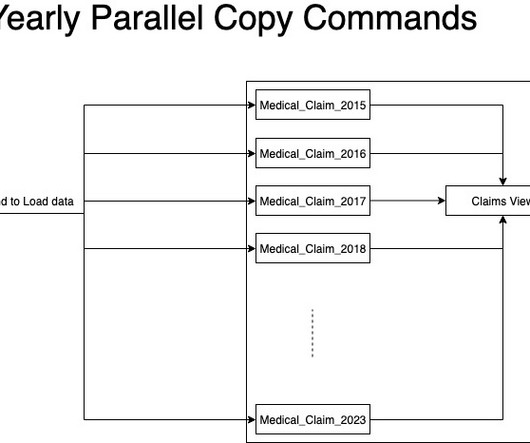
Proposed Solution approach 1: Parallel COPY command Based on the initial solution approach above, the team tested yearly parallel copy commands as illustrated in the following diagram. Ritesh Kumar Sinha is an Analytics Specialist Solutions Architect based out of San Francisco.
Areas making up the data science field include mining, statistics, data analytics, data modeling, machine learning modeling and programming. Ultimately, data science is used in defining new business problems that machine learning techniques and statistical analysis can then help solve.
“By the end of this course, participants will understand the role and value of Citizen Data Scientists and the benefits to the organization, as well as the integration points and cultural shifts that will position analytical professionals and Citizen Data Scientists to work more productively,” Patel says.
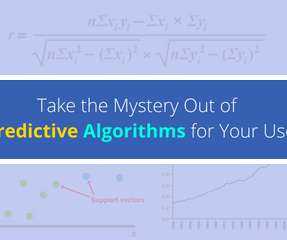
This article summarizes our recent article series on the definition, meaning and use of the various algorithms and analytical methods and techniques used in predictiveanalytics for business users, and in augmented data preparation and augmented data discovery tools.
In this paper, I show you how marketers can improve their customer retention efforts by 1) integrating disparate data silos and 2) employing machine learning predictiveanalytics. genetic counseling, genetic testing). Your marketing strategy is only as good as your ability to deliver measurable results.
We organize all of the trending information in your field so you don't have to. Join 42,000+ users and stay up to date on the latest articles your peers are reading.
You know about us, now we want to get to know you!
Let's personalize your content
Let's get even more personalized
We recognize your account from another site in our network, please click 'Send Email' below to continue with verifying your account and setting a password.


Let's personalize your content