This site uses cookies to improve your experience. To help us insure we adhere to various privacy regulations, please select your country/region of residence. If you do not select a country, we will assume you are from the United States. Select your Cookie Settings or view our Privacy Policy and Terms of Use.
Cookie Settings
Cookies and similar technologies are used on this website for proper function of the website, for tracking performance analytics and for marketing purposes. We and some of our third-party providers may use cookie data for various purposes. Please review the cookie settings below and choose your preference.
Used for the proper function of the website
Used for monitoring website traffic and interactions
Cookie Settings
Cookies and similar technologies are used on this website for proper function of the website, for tracking performance analytics and for marketing purposes. We and some of our third-party providers may use cookie data for various purposes. Please review the cookie settings below and choose your preference.
Strictly Necessary: Used for the proper function of the website
Performance/Analytics: Used for monitoring website traffic and interactions
there are two answers that go hand in hand: good exploitation of your analytics, that come from the results of a market research report. They come in handy to manage the results, but also the most important aspect of any analysis: the presentation of said results, without which it becomes hard to make accurate, sound decisions.
Whether you manage a big or small company, business reports must be incorporated to establish goals, track operations, and strategy, to get an in-depth view of the overall company state. And business report templates are the best help for that. Your Chance: Want to test professional business reporting software?
Management reporting is a source of business intelligence that helps business leaders make more accurate, data-driven decisions. But, these reports are only as useful as the work that goes into preparing and presenting them. By the end of this article, making stunning and useful managerial reports will be second nature to you.
The answer is modern agency analytics reports and interactive dashboards. Starting with its definition, following with the benefits of agency reports, a list of tools, and a set of agency dashboard examples. We will then finish with 8 valuable tips to achieve a successful agency reporting process. What Are Agency Analytics?
Organizations look to embedded analytics to provide greater self-service for users, introduce AI capabilities, offer better insight into data, and provide customizable dashboards that present data in a visually pleasing, easy-to-access format.
An important part of a successful business strategy is utilizing a modern data analysis tool and implementing a marketing report in its core procedures that will become the beating heart of acquiring customers, researching the market, providing detailed data insights into the most valuable information for any business: is our performance on track?
In recent years, analytical reporting has evolved into one of the world’s most important business intelligence components, compelling companies to adapt their strategies based on powerful data-driven insights. What Is An Analytical Report? Your Chance: Want to build your own analytical reports completely free? Let’s get started.
With the rate of available data growing exponentially, it’s crucial to work with the right online reporting tools to not only segment, curate, and analyze large data sets but also uncover answers to new questions that you didn’t even know existed. Your Chance: Want to benefit from modern ad hoc reporting?
Big data plays a crucial role in online data analysis , business information, and intelligent reporting. That’s where business intelligence reporting comes into play – and, indeed, is proving pivotal in empowering organizations to collect data effectively and transform insight into action. What Is BI Reporting?
Embedding dashboards, reports and analytics in your application presents unique opportunities and poses unique challenges. We interviewed 16 experts across business intelligence, UI/UX, security and more to find out what it takes to build an application with analytics at its core.
Warnings and failures appear in logs and reports that can help the data team pinpoint problems with laser-like accuracy. Below we’ll show an actual report used by a DataOps enterprise. It helps people keep their “finger on the pulse” of what is happening, so stakeholders started calling it the “Pulse Report.”. The Pulse Report.
As a business, you need the reliability of frequent financial reports to gain a better grasp of your financial status, both current and future. A robust finance report communicates crucial financial information that covers a specified period through daily, weekly, and monthly financial reports. What Is A Finance Report?
To put the power of CRM software (or customer relationship management dashboard software) into a living, breathing, real-world perspective, we’ll explore CRM dashboards in more detail, starting with basic definitions of such dashboards and reports while considering how you can use CRM dashboard software to your business-boosting advantage.
In essence, in this post, we will explain all the details needed for dashboard reporting and creation, compare interactive vs. static reporting, and provide tips and tricks to make your business perform even better. Interactive Dashboards vs. Static Reporting. With modern reporting tools , there is no need to do so.
Speaker: Javier Ramírez, Senior AWS Developer Advocate, AWS
Can business people create reports via drag and drop? Javier Ramirez will present: The typical steps for building a data lake. Can operations monitor what’s going on? Will the data lake scale when you have twice as much data? Is your data secure?
When a question gets asked, run its text through this same embedding model, determine which chunks are nearest neighbors , then present these chunks as a ranked list to the LLM to generate a response. presented the TRACE framework for measuring results, which showed how GraphRAG achieves an average performance improvement of up to 14.03%.
1) What Are Accounting Reports? 2) Why Do You Need Accounting Reports? 3) Types Of Accounting Reports. 4) Accounting Reports Examples. 5) The Role Of Visuals In Accountant Reports. On the basis of every company’s competent management, we can find accounting reports. What Are Accounting Reports?
Data engineering plays a pivotal role in the vast data ecosystem by collecting, transforming, and delivering data essential for analytics, reporting, and machine learning. This article presents the top 20 data engineering project ideas with their source code.
1) What Is Content Reporting? 3) Why Is Content Report Analysis Important? 5) Content Reporting Best Practices. Enter modern content reports. What Is Content Reporting? This is no longer the case, thanks to the introduction of modern reporting tools such as interactive dashboards. Which we present below.
Table of Contents 1) What Is The Report Definition? 2) Top 14 Types Of Reports 3) What Does A Report Look Like? Businesses have been producing reports since, forever. This presents a problem for many modern organizations today as building reports can take from hours to days. What Is The Report Definition?
These are systems that engage in conversations and integrate with APIs but dont create stand-alone content like emails, presentations, or documents. To get a sense of the unreliable nature of the prompt-and-pray approach, consider that Hugging Face reports the state of the art on function calling is well under 90% accurate.
Table of Contents 1) What Are White Label Reports? 2) Benefits Of White Label Reports 3) Key White Label Reporting Features 4) White Label Dashboards & Report Examples In today’s competitive business environment, building a brand that is trusted, recognizable, and loved by many is not an easy task.
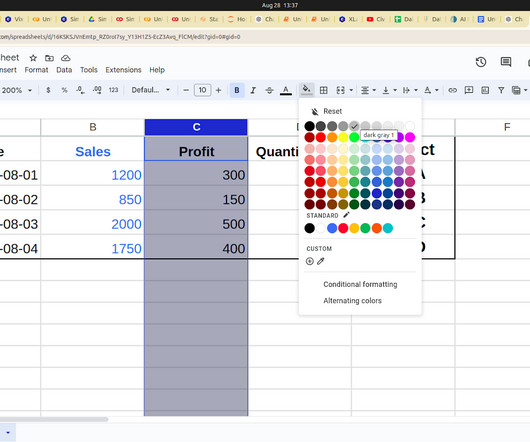
Given that crucial business decisions hinge on accurate reports, formatting errors can lead to significant issues. This article will help you understand about data presentation and formatting in Excel. Introduction Handling data efficiently in Excel can be challenging for analysts.
According to the survey reports, around 90% of the present data was generated only in the past two years. Introduction In this technical era, Big Data is proven as revolutionary as it is growing unexpectedly. Big data is nothing but the vast volume of datasets measured in terabytes or petabytes or even more.
In our recent report examining technical debt in the age of generative AI , we explored how companies need to break their technical debt down into four categories. Present a balanced solution Here’s where many CIOs stumble: presenting technical debt as a problem that needs to be eliminated.
It is the responsibility of the CISO to present the risk posture to the board in a way that is clear and that outlines the accepted risks inherent in the security program implementation. Correlating all of these activities into a single, easy-to-read, and easy-to-understand report for board members is complicated.
Choose a BI Reporting Tool that Tells You What You Need to Know! The ideal business intelligence and analytics solution includes traditional BI features, modern BI and analytics components and a full suite of reporting capabilities that are easy for your team to use, and will produce clear, concise results for fact-based decision-making.
Introduction on Power BI As part of our discussion, we will discuss the features of Power BI, its benefits, and a detailed description of how to use it for presenting data using an example and creating reports. Business today generates enormous amounts of […].
3) The Role Of Data Drilling In Reporting. 4) Drill Down & Drill Through Reporting Examples. From automated reporting, predictive analytics, and interactive data visualizations, reporting on data has never been easier. Your Chance: Want to start building your own interactive reports today? Table of Contents.
The trends we presented last year will continue to play out through 2020. 2020 will be the year of data quality management and data discovery: clean and secure data combined with a simple and powerful presentation. Time gain is also present in the form of AI assistants. Suddenly advanced analytics wasn’t just for the analysts.
As many organizations shift services from in-house datacenters to external cloud services, the potential for reduced power consumption and reduced carbon emissions presents an opportunity to report improvements in ESG. An MIT report determined that the carbon footprint for all datacenters globally, about 0.3%
We have written about management reporting methods that can be utilized in the modern practice of creating powerful analysis, bringing complex data into simple visuals, and employ them to make actionable decisions. Try our professional reporting software for 14 days, completely free! How To Select Operational Metrics And KPIs?
CEO dashboards and CEO reports are the answer. Here, we’ll consider what a leadership dashboard is, what it does, explore a selection of real-world CEO dashboard examples to demonstrate the power of this valuable leadership tool followed by top tips to create CEO reports. But how can you achieve this? Let’s get started.
In a damning audit report , Grant Thornton has exposed how the project implementation turned into a cautionary tale of project mismanagement, highlighting critical failures in governance, technical oversight, and vendor management that continue to impact the councils core operations. Staff concerns were systematically downplayed or ignored.
Digital data not only provides astute insights into critical elements of your business but if presented in an inspiring, digestible, and logical format, it can tell a tale that everyone within the organization can get behind. Data visualization methods refer to the creation of graphical representations of information.
By eliminating time-consuming tasks such as data entry, document processing, and report generation, AI allows teams to focus on higher-value, strategic initiatives that fuel innovation. This type of data mismanagement not only results in financial loss but can damage a brand’s reputation. Data breaches are not the only concern.
AI deployment will also allow for enhanced productivity and increased span of control by automating and scheduling tasks, reporting and performance monitoring for the remaining workforce which allows remaining managers to focus on more strategic, scalable and value-added activities.”
From Fortune 100 companies to small business owners, BI tools and technology are becoming the standard to oversee historical, present, and future data of business operations. Reducing the reporting time. But what makes these projects successful and what to look out for? US-based financial services provider. Fast implementation.
IT leaders face many challenging tasks, but few are more daunting than engaging with a direct report who has, in one way or another, become unreliable or neglectful. There are various reasons why a manager or executive may need to have a frank conversation with a direct report, says Orla Daly, CIO at training services provider Skillsoft.
The next generation of leaders in family businesses is poised to embrace the transformative power of generative AI (GenAI) despite marked resistance from the incumbent leaders, according to a PwC report. The survey findings too echoed Hinojosa’s sentiment.
When asked what holds back the adoption of machine learning and AI, survey respondents for our upcoming report, “Evolving Data Infrastructure,” cited “company culture” and “difficulties in identifying appropriate business use cases” among the leading reasons. AI and machine learning in the enterprise. Deep Learning.
And, it can take days or weeks to create reports and dashboards — maybe longer if processes change and new data sources are introduced. Our Analytics and Data Benchmark Research shows that the most time-consuming processes are preparing data, reviewing it for quality issues and preparing reports for presentation and distribution.
Second, decision-makers increasingly rely on genAI to … ask questions about their financial and operational data without relying on traditional dashboards and reports,” said Greenstein.” I’m deeply involved in understanding the possibilities that AI presents while also being cognizant of its limitations.
Without the existence of dashboards and dashboard reporting practices, businesses would need to sift through colossal stacks of unstructured data, which is both inefficient and time-consuming. you would often need an IT professional prepare data reports for you. These innovations offer no swipe-able screens or easy-to-use interfaces.
We organize all of the trending information in your field so you don't have to. Join 42,000+ users and stay up to date on the latest articles your peers are reading.
You know about us, now we want to get to know you!
Let's personalize your content
Let's get even more personalized
We recognize your account from another site in our network, please click 'Send Email' below to continue with verifying your account and setting a password.


Let's personalize your content