This site uses cookies to improve your experience. To help us insure we adhere to various privacy regulations, please select your country/region of residence. If you do not select a country, we will assume you are from the United States. Select your Cookie Settings or view our Privacy Policy and Terms of Use.
Cookie Settings
Cookies and similar technologies are used on this website for proper function of the website, for tracking performance analytics and for marketing purposes. We and some of our third-party providers may use cookie data for various purposes. Please review the cookie settings below and choose your preference.
Used for the proper function of the website
Used for monitoring website traffic and interactions
Cookie Settings
Cookies and similar technologies are used on this website for proper function of the website, for tracking performance analytics and for marketing purposes. We and some of our third-party providers may use cookie data for various purposes. Please review the cookie settings below and choose your preference.
Strictly Necessary: Used for the proper function of the website
Performance/Analytics: Used for monitoring website traffic and interactions
However, today’s business world still lacks a way to present market-based research results in an efficient manner – the static, antiquated nature of PowerPoint makes it a bad choice in the matter, yet it is still widely used to present results. Your Chance: Want to test a market research reporting software? Let’s get started.
These are systems that engage in conversations and integrate with APIs but dont create stand-alone content like emails, presentations, or documents. Instead of having LLMs make runtime decisions about business logic, use them to help create robust, reusable workflows that can be tested, versioned, and maintained like traditional software.
Are you ready to test your knowledge? In this quiz series, we present 10 intriguing questions about machine learning algorithms. Whether you’re an experienced data professional, a budding learner, or simply someone who relishes a stimulating mental exercise, our quizzes are designed to engage all levels of expertise.
Tools and interfaces that present the data and insights from the digital twin in an understandable format. Simulations allow for scenario testing and optimization without impacting the physical system. These tools must be user-friendly and capable of presenting complex data in an accessible manner. Prototyping and testing.
As a result, most organizations struggle to answer network design questions or test hypotheses in weeks, when results are demanded in hours. It presents the findings of a recent network maturity quiz carried out among dozens of supply chain professionals and draws on Supply Chain Insights' research findings on this topic.
In this post, we discuss the enhancement and present several use cases that the enhancement unlocks for your Amazon MWAA environment. response = client.create( key="test", value="Test value", description="Test description" ) print(response) print("nListing all variables.") Creating a test variable.
“Hail the QA Engineer” may be clickbait, but it isn’t controversial to say that testing and debugging will rise in importance. First, one of the cornerstones of QA is testing. Generative AI can generate tests, of course—at least it can generate unit tests, which are fairly simple. Programming culture is another problem.
This article poses some questions and (perhaps) some answers, without trying to present any conclusions. We know how to test whether or not code is correct (at least up to a certain limit). Given enough unit tests and acceptance tests, we can imagine a system for automatically generating code that is correct.
There are many areas of research and focus sprouting from the capabilities presented through LLMs. Development teams starting small and building up, learning, testing and figuring out the realities from the hype will be the ones to succeed. In our real-world case study, we needed a system that would create test data.
Don’t get bogged down in testing multiple solutions that never see the light of day. Present a balanced solution Here’s where many CIOs stumble: presenting technical debt as a problem that needs to be eliminated. Take out costs and use those funds to compress your transformation. Also, beware the proof-of-concept trap.
Your Chance: Want to test professional business reporting software? When the presentation becomes interactive, clicks will provide even deeper insights into your financial KPIs, findings, and desired outcomes to make a company healthy in its financial operations. Your Chance: Want to test professional business reporting software?
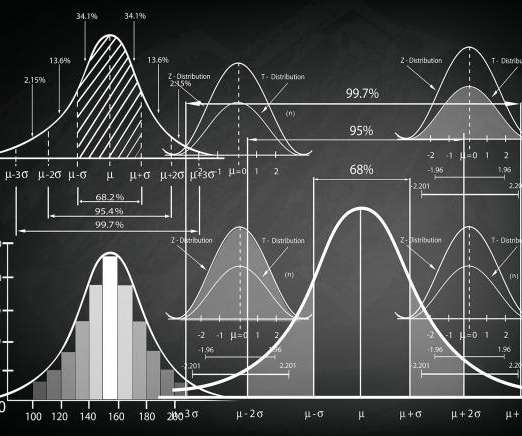
The main benefit of statistics is that information is presented in an easy-to-understand format. Data processing is […]. The post End to End Statistics for Data Science appeared first on Analytics Vidhya.
The applications must be integrated to the surrounding business systems so ideas can be tested and validated in the real world in a controlled manner. With these five layers, we can present a highly productive, data-centric software interface that enables iterative development of large-scale data-intensive applications.
Your Chance: Want to test a powerful agency analytics software? Today agencies should focus on driving valuable insights from their data and presenting them in an understandable way for stakeholders to see; in other words, crowded excel sheets or infinite PowerPoint presentations are no longer enough. What Are Agency Analytics?
This impending shift not only poses significant risks for individuals but also presents a high-stakes event that every enterprise must anticipate and prepare for; inadequate preparation could lead to substantial data breaches, compromised systems and irrevocable damage to customer trust and organizational reputation.
It’s important to test every stage of this pipeline carefully: translation software, text-to-speech software, relevance scoring, document pruning, and the language models themselves: can another model do a better job? Digital Green tests with “Golden QAs,” highly rated sets of questions and answers. Results need to pass human review.
This allows developers to test their application with a Kafka cluster that has the same configuration as production and provides an identical infrastructure to the actual environment without needing to run Kafka locally. Test the connection to the Amazon MSK server by entering the following command. Trying 127.0.0.1. amazonaws.com.
ML presents a problem for CI/CD for several reasons. The data that powers ML applications is as important as code, making version control difficult; outputs are probabilistic rather than deterministic, making testing difficult; training a model is processor intensive and time consuming, making rapid build/deploy cycles difficult.
And ensure effective and secure AI rollouts AI is everywhere, and while its benefits are extensive, implementing it effectively across a corporation presents challenges. Deliver value from generative AI As organizations move from experimenting and testing generative AI use cases , theyre looking for gen AI to deliver real business value.
These plugins can be downloaded from the plugins store and are presently only available to a select group of users. The introduction of ChatGPT modules by Open AI is intended to improve the user experience. Users of ChatGPT can anticipate increased convenience as a result of the launch of these plugins.
Your Chance: Want to test an agile business intelligence solution? Business intelligence is moving away from the traditional engineering model: analysis, design, construction, testing, and implementation. Test BI in a small group and deploy the software internally. Finalize testing. Without further ado, let’s begin.
The risk is exemplified by the case of an executive canceling Microsoft Copilot subscriptions supposedly because “he compared the slide-generation capability of Microsoft’s AI tools to ‘middle school presentations.’” That presentation in question sits inside two workflows. or the dreaded ‘ meeting before the meeting ’)?”
First, the machine learning community has conducted groundbreaking research in many areas of interest to companies, and much of this research has been conducted out in the open via preprints and conference presentations. A catalog or a database that lists models, including when they were tested, trained, and deployed.
But, these reports are only as useful as the work that goes into preparing and presenting them. They collect data from various departments of the company tracking key performance indicators ( KPIs ) and present them in an understandable way. Let’s dive into the best practices for preparing and presenting them.
But often that’s how we present statistics: we just show the notes, we don’t play the music.” – Hans Rosling, Swedish statistician. Data visualization, or ‘data viz’ as it’s commonly known, is the graphic presentation of data. But if the same insights or metrics are presented in a simple graph, the number rises to 97%.
And that brings our story to the present day: Stage 3: Neural networks High-end video games required high-end video cards. You can see a simulation as a temporary, synthetic environment in which to test an idea. Millions of tests, across as many parameters as will fit on the hardware. Specifically, through simulation.
Every operation, every step, and every transaction in the data pipeline is tested and verified. If critical data is present, the automated orchestration executes the builds. Late – new file not present after a specific target delivery time. An error could occur in any of the millions of steps in the data pipeline.
Integration with Oracles systems proved more complex than expected, leading to prolonged testing and spiraling costs, the report stated. The audit found that reporting consistently presented an optimistic view, burying serious risks and challenges in supporting materials where they were less likely to attract attention or scrutiny.
Digital data not only provides astute insights into critical elements of your business but if presented in an inspiring, digestible, and logical format, it can tell a tale that everyone within the organization can get behind. Data visualization methods refer to the creation of graphical representations of information. Set Your Goals.
To assess the Spark engines performance with the Iceberg table format, we performed benchmark tests using the 3 TB TPC-DS dataset, version 2.13 (our results derived from the TPC-DS dataset are not directly comparable to the official TPC-DS results due to setup differences). The following figure presents the total runtimes in seconds.
Some will argue that observability is nothing more than testing and monitoring applications using tests, metrics, logs, and other artifacts. Below we will explain how to virtually eliminate data errors using DataOps automation and the simple building blocks of data and analytics testing and monitoring. . Tie tests to alerts.
This may involve embracing redundancies or testing new tools for future operations. The aim is to manage present needs and be able to enlist new capabilities to meet future demands,” Carter said. Having a Plan B is table stakes for any IT team.
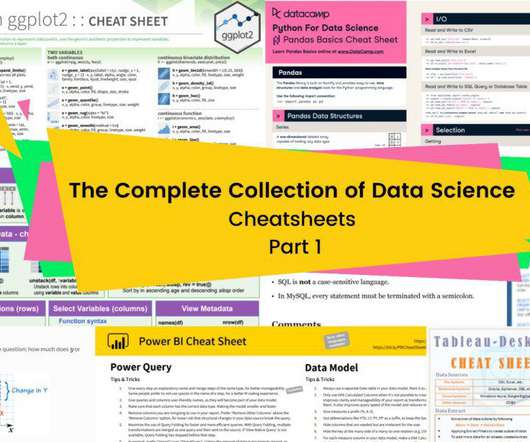
A collection of cheat sheets that will help you prepare for a technical interview, assessment tests, class presentation, and help you revise core data science concepts.
It is advised to discourage contributors from making changes directly to the production OpenSearch Service domain and instead implement a gatekeeper process to validate and test the changes before moving them to OpenSearch Service. es.amazonaws.com' # e.g. my-test-domain.us-east-1.es.amazonaws.com, Leave the settings as default.
Web and application developers rely on synthetic monitoring that simulate user interactions at scale to measure performance and availability for different scenarios, locations, and devices instead of waiting for real users to hit problem areas or to test new apps and features before launch.
Your Chance: Want to test interactive dashboard software for free? Gone are the days of static presentations, stagnate reports, and waiting on analysts to pull reports and then having out-of-date data. When using traditional spreadsheets or PowerPoint presentations, data is inserted once and updated manually. Let’s get started.
Prerequisites To walk through the examples in this post, you need the following prerequisites: You can test the incremental refresh of materialized views on standard data lake tables in your account using an existing Redshift data warehouse and data lake. However, if you want to test the examples using sample data, download the sample data.
Langer stresses the need for stronger protection, while Jacknis emphasizes the importance of testing internal controls. AI presents a key opportunity for CIOs to expand their influence, building on their leadership in cloud computing, mobility, and remote work.
Some companies are beginning to build their own solutions, and several will be presenting them at Strata Data in NYC this coming Fall—e.g., A catalog or a database that lists models, including when they were tested, trained, and deployed. Marquez (WeWork) and Databook (Uber). Metadata and artifacts needed for audits.
If you don’t believe me, feel free to test it yourself with the six popular NLP cloud services and libraries listed below. In a test done during December 2018, of the six engines, the only medical term (which only two of them recognized) was Tylenol as a product. David Blei on “Topic models: Past, present, and future”.
present a significant barrier to adoption of the latest and greatest approaches. Fractal’s recommendation is to take an incremental, test and learn approach to analytics to fully demonstrate the program value before making larger capital investments. Build multiple MVPs to test conceptually and learn from early user feedback.
Researchers can access the exact data snapshots that were present in the past, and then run their models and strategies against this historical data, without the risk of inadvertently incorporating future information. This speed boost enables quant researchers to analyze larger datasets and test trading strategies more rapidly.
The trends we presented last year will continue to play out through 2020. 2020 will be the year of data quality management and data discovery: clean and secure data combined with a simple and powerful presentation. Time gain is also present in the form of AI assistants. Suddenly advanced analytics wasn’t just for the analysts.
A CRM dashboard is a centralized hub of information that presents customer relationship management data in a way that is dynamic, interactive, and offers access to a wealth of insights that can improve your consumer-facing strategies and communications. Test, tweak, evolve. What Is A CRM Dashboard?
We organize all of the trending information in your field so you don't have to. Join 42,000+ users and stay up to date on the latest articles your peers are reading.
You know about us, now we want to get to know you!
Let's personalize your content
Let's get even more personalized
We recognize your account from another site in our network, please click 'Send Email' below to continue with verifying your account and setting a password.


Let's personalize your content