This site uses cookies to improve your experience. To help us insure we adhere to various privacy regulations, please select your country/region of residence. If you do not select a country, we will assume you are from the United States. Select your Cookie Settings or view our Privacy Policy and Terms of Use.
Cookie Settings
Cookies and similar technologies are used on this website for proper function of the website, for tracking performance analytics and for marketing purposes. We and some of our third-party providers may use cookie data for various purposes. Please review the cookie settings below and choose your preference.
Used for the proper function of the website
Used for monitoring website traffic and interactions
Cookie Settings
Cookies and similar technologies are used on this website for proper function of the website, for tracking performance analytics and for marketing purposes. We and some of our third-party providers may use cookie data for various purposes. Please review the cookie settings below and choose your preference.
Strictly Necessary: Used for the proper function of the website
Performance/Analytics: Used for monitoring website traffic and interactions
ArticleVideo Book This article was published as a part of the Data Science Blogathon Source Introduction: In this article, we will learn all the important. The post A Guide To Complete Statistics For Data Science Beginners! appeared first on Analytics Vidhya.
ArticleVideos This article was published as a part of the Data Science Blogathon. You can have data without information, but you cannot have information. The post Essential Statistical Concepts for Data Cognizance appeared first on Analytics Vidhya.
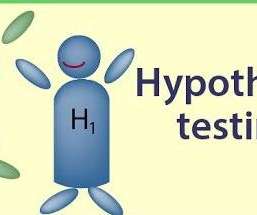
ArticleVideo Book This article was published as a part of the Data Science Blogathon Introduction Hypothesis testing is one of the most important concepts in. The post Hypothesis Testing- Parametric and Non-Parametric Tests in Statistics appeared first on Analytics Vidhya.
This article was published as a part of the Data Science Blogathon. The post Interpreting P-Value and R Squared Score on Real-Time Data – StatisticalData Exploration appeared first on Analytics Vidhya. Overview In this article, I will share my thoughts on the below.
ArticleVideo Book This article was published as a part of the Data Science Blogathon Introduction Data Science is an interdisciplinary field that uses various algorithms. The post Introductory Statistics for Data Science! appeared first on Analytics Vidhya.
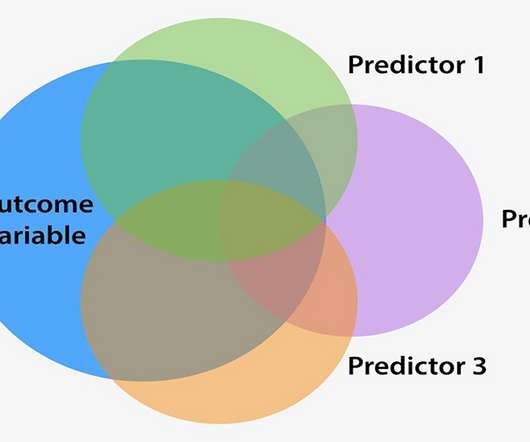
ArticleVideo Book This article was published as a part of the Data Science Blogathon Introduction Feature Selection is the process of selecting the features which. The post Feature Selection using Statistical Tests appeared first on Analytics Vidhya.
This article was published as a part of the Data Science Blogathon. Regression analysis is used to solve problems of prediction based on datastatistical parameters. In this article, we will look at the use of a polynomial regression model on a simple example using real statisticdata.
ArticleVideo Book This article was published as a part of the Data Science Blogathon Introduction In applied Statistics and Machine Learning, Data Visualization is one. The post Must Known Data Visualization Techniques for Data Science appeared first on Analytics Vidhya.
This article was published as a part of the Data Science Blogathon What is Hypothesis Testing? Any data science project starts with exploring the data. When we perform an analysis on a sample through exploratory data analysis and inferential statistics we get information about the sample.
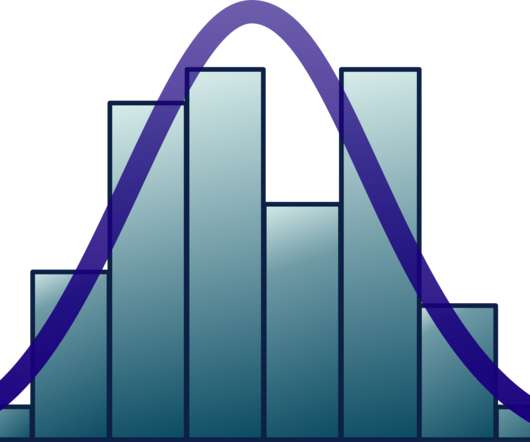
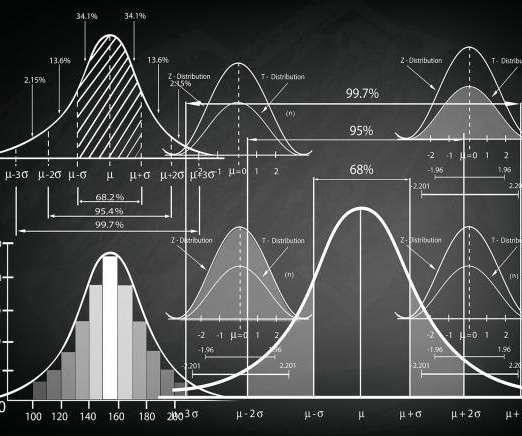
ArticleVideo Book This article was published as a part of the Data Science Blogathon Introduction The normal distribution is an important class of Statistical Distribution that. The post Normal Distribution : An Ultimate Guide appeared first on Analytics Vidhya.
ArticleVideo Book This article was published as a part of the Data Science Blogathon. Introduction Statistics is the foundation of Data Science. Before jumping to. The post Five Number Summary for Analysis! appeared first on Analytics Vidhya.
ArticleVideo Book This article was published as a part of the Data Science Blogathon Introduction Many engineers have never worked in statistics or data science. The post Know the basics of Exploratory Data Analysis appeared first on Analytics Vidhya.
This article was published as a part of the Data Science Blogathon. Machine Learning is the method of teaching computer programs to do a specific task accurately (essentially a prediction) by training a predictive model using various statistical algorithms leveraging data. Source: [link] For […].
This article was published as a part of the Data Science Blogathon. Introduction A popular and widely used statistical method for time series forecasting. The post How to Create an ARIMA Model for Time Series Forecasting in Python appeared first on Analytics Vidhya.
ArticleVideos This article was published as a part of the Data Science Blogathon. What is Multicollinearity? One of the key assumptions for a regression-based. The post Multicollinearity: Problem, Detection and Solution appeared first on Analytics Vidhya.
This article was published as a part of the Data Science Blogathon Introduction Q-Q plots are also known as Quantile-Quantile plots. As the name suggests, they plot the quantiles of a sample distribution against quantiles of a theoretical distribution.
ArticleVideos This article was published as a part of the Data Science Blogathon. Introduction Can you tell how the prices of gold will change. The post Correlation Analysis Using R appeared first on Analytics Vidhya.
ArticleVideo Book This article was published as a part of the Data Science Blogathon Introduction In my previous article, I talk about the theoretical concepts. The post Feature Engineering – How to Detect and Remove Outliers (with Python Code) appeared first on Analytics Vidhya.
This article was published as a part of the Data Science Blogathon. Introduction The world of business has completely changed and revolves around its. The post A Definitive Guide for predicting Customer Lifetime Value (CLV) appeared first on Analytics Vidhya.
ArticleVideo Book This article was published as a part of the Data Science Blogathon. The post Zooming Out – A Look at Outlier and How to Deal with them in Data Science appeared first on Analytics Vidhya. Before we get started the discussion on Outliers, we should.
ArticleVideo Book This article was published as a part of the Data Science Blogathon. The post Multicollinearity in Data Science appeared first on Analytics Vidhya. Introduction Multicollinearity is a topic in Machine Learning of which.
ArticleVideo Book This article was published as a part of the Data Science Blogathon Introduction Exploratory Data Analysis is a set of techniques that. The post How To Perform Exploratory Data Analysis -A Guide for Beginners appeared first on Analytics Vidhya.
ArticleVideos This article was published as a part of the Data Science Blogathon. Introduction When we try to infer something from what we have. The post Beginner’s Guide to Pearson’s Correlation Coefficient appeared first on Analytics Vidhya.
This article was published as a part of the Data Science Blogathon. The biggest religion in the world is not even a religion.” –. The post Bet Wisely: Predicting the Scoreline of a Football Match using Poisson Distribution appeared first on Analytics Vidhya.
ArticleVideos This article was published as a part of the Data Science Blogathon. What is Exploratory Data Analysis? The very first step in data. The post Making Exploratory Data Analysis Sweeter with Sweetviz 2.0 appeared first on Analytics Vidhya.
Existing Redshift data warehouses can be made available through SageMaker Lakehouse in just a simple publish step, opening up all your data warehouse data with Iceberg REST API. You can also create new data lake tables using Redshift Managed Storage (RMS) as a native storage option.
ArticleVideos This article was published as a part of the Data Science Blogathon. Introduction Naive Bayes is a classification technique based on the Bayes. The post Gaussian Naive Bayes with Hyperpameter Tuning appeared first on Analytics Vidhya.
ArticleVideo Book This article was published as a part of the Data Science Blogathon Source Introduction: In this article, we will be learning different types. The post Exploring The Different Types Of Probability Distribution Function! appeared first on Analytics Vidhya.
ArticleVideo Book This article was published as a part of the Data Science Blogathon Introduction In one of my previous articles, I have explained the. The post Let’s Unfold the Mystery of Different Probability Distributions! appeared first on Analytics Vidhya.
This article was published as a part of the Data Science Blogathon. Introduction Have you ever been tasked with visualizing the relationship between each. The post Creating Linear Model, It’s Equation and Visualization for Analysis appeared first on Analytics Vidhya.
ArticleVideo Book This article was published as a part of the Data Science Blogathon. Introduction In Data Processing, we try to change the data in. The post Feature Scaling Techniques in Python – A Complete Guide appeared first on Analytics Vidhya.
ArticleVideo Book This article was published as a part of the Data Science Blogathon. The post How to check Stationarity of Data in Python appeared first on Analytics Vidhya. Introduction Hello readers! In our routine life, we come.
ArticleVideo Book This article was published as a part of the Data Science Blogathon Introduction Exploratory data analysis is an approach to analyzing data sets. The post Exploratory Data Analysis : A Beginners Guide To Perform EDA appeared first on Analytics Vidhya.
ArticleVideo Book This article was published as a part of the Data Science Blogathon Introduction Cutting straight right to the chase, Hurst exponent is a. The post Using Hurst Exponent to analyse the Stock and Crypto market with Python appeared first on Analytics Vidhya.
ArticleVideo Book This article was published as a part of the Data Science Blogathon. Every Data Scientist Should Know appeared first on Analytics Vidhya. What is A/B testing? A/B Testing(split testing) is basically the. The post A/B Testing Measurement Frameworks ?- ?Every
ArticleVideo Book This article was published as a part of the Data Science Blogathon. Introduction : The goal is to create a replica of. The post Create a Dummy Stock Market Using Geometric Brownian Motion in Python appeared first on Analytics Vidhya.
ArticleVideo Book This article was published as a part of the Data Science Blogathon Introduction Whenever we build any machine learning model, we feed it. The post 4 Ways to Evaluate your Machine Learning Model: Cross-Validation Techniques (with Python code) appeared first on Analytics Vidhya.
ArticleVideo Book This article was published as a part of the Data Science Blogathon Greetings, I am Mustafa Sidhpuri a Computer Science and Engineering student. The post Understanding The Concept Of Hypothesis In Data Science! appeared first on Analytics Vidhya.
ArticleVideo Book This article was published as a part of the Data Science Blogathon. Introduction to GBM One of the common ways to price a. The post Bayesian Approach(Geometric Brownian Motion) in Stock Price Simulation appeared first on Analytics Vidhya.
Machine learning identifies patterns in data using algorithms that are primarily based on traditional methods of statistical learning. It’s most helpful in analyzing structureddata. Based on the concept of neural networks, it’s useful for analyzing images, videos, text and other unstructured data.
AWS Glue Data catalog now automates generating statistics for new tables The AWS Glue Data Catalog now automates generating statistics for new tables. These statistics are integrated with a cost-based optimizer (CBO) from Amazon Redshift and Athena, resulting in improved query performance and potential cost savings.
ArticleVideo Book This article was published as a part of the Data Science Blogathon Introduction Using the machine learning models in your projects is quite. The post Getting Started with Machine Learning?—?Implementing Implementing Linear Regression from Scratch appeared first on Analytics Vidhya.
Preparing and annotating data IBM watsonx.data helps organizations put their data to work, curating and preparing data for use in AI models and applications. “Being able to organize the data around that structure helps us to efficiently query, retrieve and use the information downstream, for example for AI narration.”
Data is usually visualized in a pictorial or graphical form such as charts, graphs, lists, maps, and comprehensive dashboards that combine these multiple formats. Data visualization is used to make the consuming, interpreting, and understanding data as simple as possible, and to make it easier to derive insights from data.
We organize all of the trending information in your field so you don't have to. Join 42,000+ users and stay up to date on the latest articles your peers are reading.
You know about us, now we want to get to know you!
Let's personalize your content
Let's get even more personalized
We recognize your account from another site in our network, please click 'Send Email' below to continue with verifying your account and setting a password.


Let's personalize your content