This site uses cookies to improve your experience. To help us insure we adhere to various privacy regulations, please select your country/region of residence. If you do not select a country, we will assume you are from the United States. Select your Cookie Settings or view our Privacy Policy and Terms of Use.
Cookie Settings
Cookies and similar technologies are used on this website for proper function of the website, for tracking performance analytics and for marketing purposes. We and some of our third-party providers may use cookie data for various purposes. Please review the cookie settings below and choose your preference.
Used for the proper function of the website
Used for monitoring website traffic and interactions
Cookie Settings
Cookies and similar technologies are used on this website for proper function of the website, for tracking performance analytics and for marketing purposes. We and some of our third-party providers may use cookie data for various purposes. Please review the cookie settings below and choose your preference.
Strictly Necessary: Used for the proper function of the website
Performance/Analytics: Used for monitoring website traffic and interactions
ArticleVideo Book This article was published as a part of the Data Science Blogathon Introduction Bayesian decision theory refers to the statistical approach based on. The post An Intuitive Introduction to Bayesian Decision Theory appeared first on Analytics Vidhya.
Introduction Bike-sharing demand analysis refers to the study of factors that impact the usage of bike-sharing services and the demand for bikes at different times and locations. The purpose of this analysis is to understand the patterns and trends in bike usage and make predictions about future demand.
A Latent Space Theory for Emergent Abilities in Large Language Models ” by Hui Jiang presents a statistical explanation for emergent LLM abilities, exploring a relationship between ambiguity in a language versus the scale of models and their training data. “ Do LLMs Really Adapt to Domains?
Use the Data formats with pandas in economics and statistics. It refers to structured data sets that hold observations across multiple periods for different entities or subjects. Introduction Pandas is more than just a name – it’s short for “panel data.” ” Now, what exactly does that mean?
Introduction Random Forests are always referred to as black-box models. This article was published as a part of the Data Science Blogathon. Let’s try. The post Lets Open the Black Box of Random Forests appeared first on Analytics Vidhya.
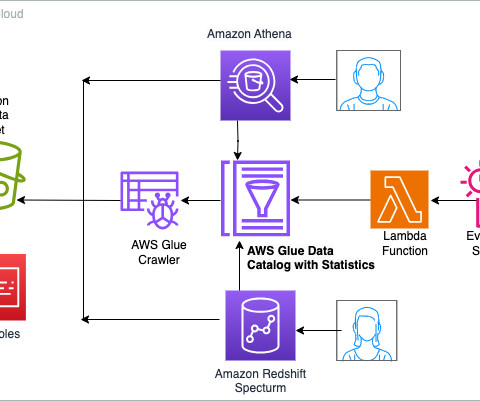
Today, we’re making available a new capability of AWS Glue Data Catalog that allows generating column-level statistics for AWS Glue tables. These statistics are now integrated with the cost-based optimizers (CBO) of Amazon Athena and Amazon Redshift Spectrum , resulting in improved query performance and potential cost savings.
Over the last year, Amazon Redshift added several performance optimizations for data lake queries across multiple areas of query engine such as rewrite, planning, scan execution and consuming AWS Glue Data Catalog column statistics. Enabling AWS Glue Data Catalog column statistics further improved performance by 3x versus last year.
Having bestowed your data analysis techniques and methods with true purpose and defined your mission, you should explore the raw data you’ve collected from all sources and use your KPIs as a reference for chopping out any information you deem to be useless. Conduct statistical analysis. Conduct statistical analysis.
Referring to the latest figures from the National Institute of Statistics, Abril highlights thatin the last five years, technological investment within the sector has grown more than 40%. This reflects the growing dependence on digital solutions to maintain competitiveness, he says.
Data unification or integration refers to the set of activities that bring this data together into one unified data context. The good news is that researchers from academia recently managed to leverage that large body of work and combine it with the power of scalable statistical inference for data cleaning.
You’ll want to be mindful of the level of measurement for your different variables, as this will affect the statistical techniques you will be able to apply in your analysis. There are basically 4 types of scales: *Statistics Level Measurement Table*. 5) Which statistical analysis techniques do you want to apply? Who are they?
A number of optimizations contribute to these speed-ups in performance, including integration with AWS Glue Data Catalog statistics, improved data and metadata filtering, dynamic partition elimination, faster/parallel processing of Iceberg manifest files, and scanner improvements.
They are then able to take in prompts and produce outputs based on the statistical weights of the pretrained models of those corpora. While perfect intelligence is no more possible in a synthetic sense than in an organic sense, retrieval-augmented generative (RAG) search engines may be the key to addressing the many concerns we listed above.
It is merely a very large statistical model that provides the most likely sequence of words in response to a prompt. That scenario is being played out again with ChatGPT and prompt engineering, but now our queries are aimed at a much more language-based, AI-powered, statistically rich application. Guess what? It isn’t.
Since the AI chatbots 2022 debut, CIOs at the nearly 4,000 US institutions of higher education have had their hands full charting strategy and practices for the use of generative AI among students and professors, according to research by the National Center for Education Statistics. Were just too new at this to completely depend on AI.
Introduction Big Data refers to a combination of structured and unstructured data. This article was published as a part of the Data Science Blogathon. The post Big Data to Small Data – Welcome to the World of Reservoir Sampling appeared first on Analytics Vidhya.
The company is looking for an efficient, scalable, and cost-effective solution to collecting and ingesting data from ServiceNow, ensuring continuous near real-time replication, automated availability of new data attributes, robust monitoring capabilities to track data load statistics, and reliable data lake foundation supporting data versioning.
Data poisoning refers to someone systematically changing your training data to manipulate your model’s predictions. Watermarking is a term borrowed from the deep learning security literature that often refers to putting special pixels into an image to trigger a desired outcome from your model. Data poisoning attacks. Watermark attacks.
Another year has passed now and a new set of website statistics for 2021 is here, which will reveal what visualisation reference pages are the most popular. It’s always good to analyse the website statistics, as they may provide some indicator of what visualisation types are most commonly being used or taught.
For more information, refer to Amazon Redshift clusters. This feature is part of the Amazon Redshift console and provides a visual and graphical representation of the query’s run order, execution plan, and various statistics. The Query profiler is a graphical tool that helps users analyze the components and performance of a query.
One crop of people — who may not refer to themselves as citizen data scientists — are those who are proficient at working with data, solving problems, and delivering business insights. As time has passed and the analytics & data science landscapes have evolved, so have the different breeds of data scientists.
Data fabric enthusiasts assert that the design pattern is much more than that and reference one or more emerging data analytics tools: AI augmentation, automation, orchestration, semantic knowledge graphs, self-service, streaming data, composable data analytics, dynamic discovery, observability, persistence layer, caching and more.
According to the US Bureau of Labor Statistics, demand for qualified business intelligence analysts and managers is expected to soar to 14% by 2026, with the overall need for data professionals to climb to 28% by the same year. The Bureau of Labor Statistics also states that in 2015, the annual median salary for BI analysts was $81,320.
Here, we broaden our meaning of “bias” to go beyond model bias, which has the technical statistical meaning of “underfitting”, which essentially means that there is more information and structure in the data than our model has captured.
But often that’s how we present statistics: we just show the notes, we don’t play the music.” – Hans Rosling, Swedish statistician. It is a definitive reference for anyone who wants to master the art of dashboarding. 14) “Visualize This: The Flowing Data Guide to Design, Visualization, and Statistics” by Nathan Yau.
Computer Vision: Data Mining: Data Science: Application of scientific method to discovery from data (including Statistics, Machine Learning, data visualization, exploratory data analysis, experimentation, and more). They provide more like an FAQ (Frequently Asked Questions) type of an interaction. See [link]. Industry 4.0 4) Prosthetics.
What is the point of those obvious statistical inferences? In statistical terms, the joint probability of event Y and condition X co-occurring, designated P(X,Y), is essentially the probability P(Y) of event Y occurring. How do predictive and prescriptive analytics fit into this statistical framework? ” “Just 26.5%
Data interpretation refers to the process of using diverse analytical methods to review data and arrive at relevant conclusions. Quantitative analysis refers to a set of processes by which numerical data is analyzed. More often than not, it involves the use of statistical modeling such as standard deviation, mean and median.
Data scientists are experts in applying computer science, mathematics, and statistics to building models. The US Bureau of Labor Statistics says there were 149,300 data architect jobs in the US in 2022 and projects the number of data architects will grow by 8% from 2022 to 2032. Are data architects in demand?
In this post, we use the term vanilla Parquet to refer to Parquet files stored directly in Amazon S3 and accessed through standard query engines like Apache Spark, without the additional features provided by table formats such as Iceberg.
Employee engagement refers to the level of commitment employees have to their work, their team’s goals, and their company’s mission. Engaged employees understand their purpose and impact on the organization.
For instance, records may be cleaned up to create unique, non-duplicated transaction logs, master customer records, and cross-reference tables. This stage involves validation, deduplication, and merging of data from different sources, ensuring that the data is in a more consistent and reliable format.
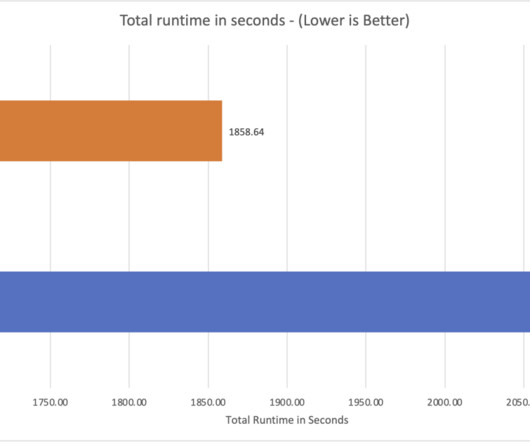
No precalculated statistics were used for these tables. Refer to Configure the AWS CLI for instructions. Refer to create-cluster for a detailed description of the AWS CLI options. We can define this setup by configuring the property spark.sql.catalog.type. Upload the benchmark application JAR file to Amazon S3.
As per tradition, the website stats on the most popular chart reference pages for the past year are made public for all readers of this website to explore. Below is the list for the Top-10 chart reference pages for 2022: But how does this list compare to last year’s Top 10? Top 10 Most Viewed Chart Reference Pages in 2018.
Naidu has a PG diploma in Applied Statistics from the Indian Statistical Institute, Calcutta and BTech in Electrical and Electronics from NIT, Warangal. He has been working on integrating generative AI capabilities into the data lake and data warehouse systems using Amazon Bedrock AI models.
Table and column statistics were not present for any of the tables. Join order and join algorithm decisions are typically a function performed by cost-based optimizers, which uses statistics to improve query plans by deciding how tables and subqueries are joined. Benchmark queries were run sequentially on two different Amazon EMR 6.15.0
Starting today, the Athena SQL engine uses a cost-based optimizer (CBO), a new feature that uses table and column statistics stored in the AWS Glue Data Catalog as part of the table’s metadata. By using these statistics, CBO improves query run plans and boosts the performance of queries run in Athena.
AI is the next generation of what we called “data science” a few years back, and data science represented a merger between statistical modeling and software development. The field may have evolved from traditional statistical analysis to artificial intelligence, but its overall shape hasn’t changed much.
That’s the case until artificial intelligence (AI) is no longer something that scientists refer to in journals. They also record usage statistics. References. However, sending bulk text messages, which is the most common method of SMS marketing, has always been more of a shotgun approach than a clinical advertising shot.
AI refers to the autonomous intelligent behavior of software or machines that have a human-like ability to make decisions and to improve over time by learning from experience. Currently, popular approaches include statistical methods, computational intelligence, and traditional symbolic AI.
The demand for real-time online data analysis tools is increasing and the arrival of the IoT (Internet of Things) is also bringing an uncountable amount of data, which will promote the statistical analysis and management at the top of the priorities list. It’s an extension of data mining which refers only to past data.
We liken this methodology to the statistical process controls advocated by management guru Dr. Edward Deming. In addition to statistical process controls, we recommend location and historical balance tests. Statistical Process Control. These are called Time Balance tests or, more commonly, statistical process control (SPC).
Classical statistics, developed in the 20 th century for small datasets, do not work for data where the number of variables is much larger than the number of samples (Large P Small N, Curse of Dimensionality, or P >> N data). Each of these behaviors wreak havoc on statistical analyses. Antimicrobial. Autoimmunity. IL-4, IL-13.
Data analytics refers to the systematic computational analysis of statistics or data. Revenue marketing aims to boost lead generation to the maximum level by using data analytics as a valuable reference for all marketing activities. It lays a core foundation necessary for business planning.
We organize all of the trending information in your field so you don't have to. Join 42,000+ users and stay up to date on the latest articles your peers are reading.
You know about us, now we want to get to know you!
Let's personalize your content
Let's get even more personalized
We recognize your account from another site in our network, please click 'Send Email' below to continue with verifying your account and setting a password.


Let's personalize your content