This site uses cookies to improve your experience. To help us insure we adhere to various privacy regulations, please select your country/region of residence. If you do not select a country, we will assume you are from the United States. Select your Cookie Settings or view our Privacy Policy and Terms of Use.
Cookie Settings
Cookies and similar technologies are used on this website for proper function of the website, for tracking performance analytics and for marketing purposes. We and some of our third-party providers may use cookie data for various purposes. Please review the cookie settings below and choose your preference.
Used for the proper function of the website
Used for monitoring website traffic and interactions
Cookie Settings
Cookies and similar technologies are used on this website for proper function of the website, for tracking performance analytics and for marketing purposes. We and some of our third-party providers may use cookie data for various purposes. Please review the cookie settings below and choose your preference.
Strictly Necessary: Used for the proper function of the website
Performance/Analytics: Used for monitoring website traffic and interactions
Imagine if you could automate the tedious task of analyzing earnings reports, extracting key insights, and making informed recommendations—all without lifting a finger. You’ll learn how to set up and orchestrate three […] The post Building an Earnings Report Agent with Swarm Framework appeared first on Analytics Vidhya.
A multimodal report generator allows you to incorporate both text and images into a final output, making your reports more dynamic and visually rich. In many real-world applications, data is not purely textualit may include images, tables, and charts that help reinforce the narrative.
What if you could paste any CSV URL and get a professional data quality report in under 30 seconds? Calculates quality scores and severity ratings Generates specific, actionable recommendations HTML Node : Transforms the analysis results into a beautiful, professional report with color-coded quality scores and clean formatting.
The record-to-report (R2R) cycle describes the process of finalizing and summarizing the financial activities of a business for a specific accounting period typically a month, quarter or fiscal year. The six costliest words in managing a finance department are, Weve always done it this way.
Speaker: Claire Grosjean, Global Finance & Operations Executive
Key Takeaways: Data Storytelling for Finance 📢 Transforming complex financial reports into clear, actionable insights. Improving Spend Visibility 🔍 Gain real-time insights into where money is going and pinpoint unnecessary spend before it impacts your bottom line.
Learn how to eliminate manual SQL reporting with an n8n workflow that automatically queries your database, formats professional HTML reports, and regularly emails them to stakeholders.
A dashboard shows anomalous metrics, a machine learning model starts producing bizarre predictions, or stakeholders complain about inconsistent reports. Reports are run on schedule, but they reflect outdated information. They don’t break your pipelines – they corrupt your insights.
And that tool is being used in a commercial medical transcription product that, worryingly, deletes the underlying audio from which transcriptions are generated, leaving medical staff no way to verify their accuracy, AP News reported on Saturday. With over 4.2
The company focused on delivering small increments of customer value data sets, reports, and other items as their guiding principle. Results In the end, the company teams data infrastructure and analytics environment were well-prepared for the launch, with key functions such as field reporting ready six months before the expected launch.
This report aims to highlight the current state of B2B database and contact acquisition strategies and organizations’ goals to leverage data to fuel their go-to-market strategies in 2020 and beyond. As buyer expectations to receive this type of relevant engagement continues to heighten, database management strategies are of high importance.
The proposed model illustrates the data management practice through five functional pillars: Data platform; data engineering; analytics and reporting; data science and AI; and data governance. The data platform function will set up the reporting and visualization tools, while the data engineering function will centralize the curated data.
In late 2023, a report from ISACA suggested that up to two-thirds of workers are using unsanctioned AI tools, despite only 11% organisations having a formal policy permitting its use. Many workers are not waiting for guidance and permission when it comes to adopting AI tools, leading to the emergence of shadow AI.
A new report from the US Government Accountability Office (GAO) appears to indicate that no US federal agency reporting into the Department of Homeland Security (DHS) knows the full extent or probability of harm that AI can do the nations critical infrastructure.
Another example is an analytic team that wants to focus on data that goes into the weekly report for the executive team. Because we MUST do them for compliance reporting to the government. This targeted approach ensures that limited resources are directed toward improving the data elements that matter most to the organization.
Data architectures to support reporting, business intelligence, and analytics have evolved dramatically over the past 10 years. Download this TDWI Checklist report to understand: How your organization can make this transition to a modernized data architecture. The decision making around this transition.
Whether its integrating multiple data sources, managing data transfers, or simply ensuring timely reporting, each component presents its own challenges. Data can arrive in batches (hourly reports) or as real-time streams (live web traffic). a star schema for reporting) 2. What Is a Data Pipeline?
By Abid Ali Awan , KDnuggets Assistant Editor on July 14, 2025 in Python Image by Author | Canva Despite the rapid advancements in data science, many universities and institutions still rely heavily on tools like Excel and SPSS for statistical analysis and reporting.
Conclusion The combination of Streamlit, Pandas, and Plotly transforms data analysis from static reports into interactive web applications. As you continue building with these tools, consider how interactive dashboards can replace traditional reporting in your organization.
The first, PDF to podcast, is an agent that can turn documents like whitepapers and financial reports into interactive podcasts. The second blueprint is a video analytics agent for analyzing video data to enable interactive search, summarization, and report generation. Daily added a voice agent blueprint.
Download this report to see what 11,000+ customers say about our Go-To-Market Intelligence platform and how it impacts their bottom line. ZoomInfo customers aren’t just selling — they’re winning. Revenue teams using our Go-To-Market Intelligence platform grew pipeline by 32%, increased deal sizes by 40%, and booked 55% more meetings.
The Nutanix State of Enterprise AI Report highlights AI adoption, challenges, and the future of this transformative technology. Survey respondents ranked ESG reporting as a top area needing AI skills development, even above R&D and product development. Nutanix commissioned U.K.
for 2025-2030, according to a report from Grand View Research. While not limited to MLOps, it’s a very popular option for orchestrating ML workflows like data extraction, model training, and reporting. It is projected that the global MLOps market will reach USD 3.03 billion in 2025, representing an increase from USD 2.19
Dataiku is also recognized in the 2025 Gartner Critical Capabilities for Data Science and Machine Learning Platforms, Core Data Science report, ranking #1 for the Product Owner Use Case.
Inefficient reporting: Manual reporting processes were time-consuming and prone to errors. Empower users: Enable self-service BI, empowering users to generate their own reports and dashboards without relying on IT. Kris mentioned that the platform has empowered Sparex to modernize its reporting system.
Those implementing a B2B sales and marketing intelligence solution reported that they have realized 35% more leads in their pipeline and 45% higher-quality leads leading to higher revenue and growth. However, organizations are fighting back - and winning.
AI deployment will also allow for enhanced productivity and increased span of control by automating and scheduling tasks, reporting and performance monitoring for the remaining workforce which allows remaining managers to focus on more strategic, scalable and value-added activities.”
Our legacy architecture consisted of multiple standalone, on-prem data marts intended to integrate transactional data from roughly 30 electronic health record systems to deliver a reporting capability. We had plenty of reporting, but very little data insight, and no real semblance of a data strategy. And you can’t take your time.
GenAI can also play a role in report summarization as well as generate new trading opportunities to increase market returns. GenAI also helps identify patterns that assist in Suspicious Activity Report generation for anti-money laundering, greatly reducing investigation time.
One executive the researchers interviewed for the report suggested AI tools are productivity “shaves,” because they save users a few minutes on each task by summarizing documents or by helping to draft an email, for example.
This report explores how the state of supply chain network design has changed – including how the tools, maturity models, and market demands are transforming the network design practice. This report is useful if you are interested in: Exploring new network design insights and capabilities. Industry benchmarks.
To get a sense of the unreliable nature of the prompt-and-pray approach, consider that Hugging Face reports the state of the art on function calling is well under 90% accurate. When dealing with enterprise workflows, this variability is unacceptable.
Validation: Ensure data meets business rules and constraints Reporting: Track what changes were made during processing Setting Up the Development Environment Please make sure you’re using a recent version of Python. You can add as many cleaning steps as needed.) 🔗 You can find the complete script on GitHub.
Picture this: It’s 2:47 AM, your Slack is buzzing with alerts, and the CFO’s quarterly report is broken because somewhere in your seven-layer medallion architecture, the bronze data doesn’t match the gold data. Teams implementing FITT principles consistently report significant improvements across multiple dimensions.
The 2024 Enterprise AI Readiness Radar report from Infosys , a digital services and consulting firm, found that only 2% of companies were fully prepared to implement AI at scale and that, despite the hype , AI is three to five years away from becoming a reality for most firms.
In the report, learn about the core set of capabilities that make data catalogs critical for self-service analytics. Our latest report validates the vital role data catalogs play in the successful rollout of those efforts.”. Download the research report to learn: Emerging business intelligence trends.
After assessment of the source SQL files, it generates a comprehensive report that provides valuable insights into the migration effort. Review the report thoroughly, because it provides a summary and in-depth explanations of the SQL analysis. for Linux and macOS).
This can be challenging, as CISOs and FinOps teams often do not fall under the same reporting structure, which can impede collaboration in some corporate cultures, especially those where security operates in a silo. This standardization lets both teams view the same reports, alerts, and response patterns.
Combine data processing, AI analysis, and professional reporting without jumping between tools or managing complex infrastructure. By combining automated analysis, intelligent recommendations, and professional reporting, you can scale feature engineering expertise across your entire organization.
For a deeper understanding of these insights and to learn more about -how your organisation can effectively implement GenAI strategies, we invite you to explore the full report. [1]
The data is clear: AI users report 47% higher productivity and an average of 12 hours saved per week. Download the full report today to see how AI is being used — and where go-to-market professionals think there are gaps and opportunities. But is it delivering real results? We surveyed 1,000+ GTM professionals to find out.
According to Unit 42’s 2024 Incident Response Report , the median time between compromise and exfiltration accelerated to just two days in 2024 (from nine days in 2022). In particular, the speed of attacks has increased exponentially, with data breaches now occurring within days or even hours of an initial compromise.
To use it, visit Perplexitys site , enter a prompt for the content you are looking to create a report on, select the "deep research" option, and send your prompt. After generating your content, review and format it into a clean, readable PDF report. NotebookLM will auto-summarize the content and make it searchable and interactive.
By subscribing you accept KDnuggets Privacy Policy Leave this field empty if youre human: Next post => Latest Posts Why Agentic AI Isn’t Pure Hype (And What Skeptics Aren’t Seeing Yet) 10 GitHub Awesome Lists for Data Science A Beginner’s Guide to Mastering Gemini + Google Sheets How to Combine Streamlit, Pandas, and Plotly for Interactive (..)
By subscribing you accept KDnuggets Privacy Policy Leave this field empty if youre human: Next post => Latest Posts The Lifecycle of Feature Engineering: From Raw Data to Model-Ready Inputs 10 Python Math & Statistical Analysis One-Liners 10 GitHub Repositories for Python Projects Building End-to-End Data Pipelines: From Data Ingestion to Analysis (..)
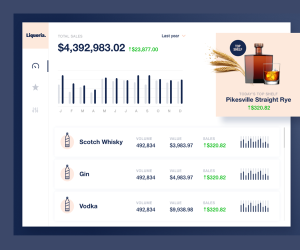
Embedding dashboards and reports aren’t enough. Futureproof your application by offering instant, actionable insights that will give you and your customers a competitive advantage.
We organize all of the trending information in your field so you don't have to. Join 42,000+ users and stay up to date on the latest articles your peers are reading.
You know about us, now we want to get to know you!
Let's personalize your content
Let's get even more personalized
We recognize your account from another site in our network, please click 'Send Email' below to continue with verifying your account and setting a password.


Let's personalize your content