This site uses cookies to improve your experience. To help us insure we adhere to various privacy regulations, please select your country/region of residence. If you do not select a country, we will assume you are from the United States. Select your Cookie Settings or view our Privacy Policy and Terms of Use.
Cookie Settings
Cookies and similar technologies are used on this website for proper function of the website, for tracking performance analytics and for marketing purposes. We and some of our third-party providers may use cookie data for various purposes. Please review the cookie settings below and choose your preference.
Used for the proper function of the website
Used for monitoring website traffic and interactions
Cookie Settings
Cookies and similar technologies are used on this website for proper function of the website, for tracking performance analytics and for marketing purposes. We and some of our third-party providers may use cookie data for various purposes. Please review the cookie settings below and choose your preference.
Strictly Necessary: Used for the proper function of the website
Performance/Analytics: Used for monitoring website traffic and interactions
In fact, data has become the raw material that every business decision is based on while reporting tools create the environment to act on generated information swiftly and accurately. Tracking the success metrics based on your needs, and the time frame you select while comparing your values can be done with simple yet effective scorecards.
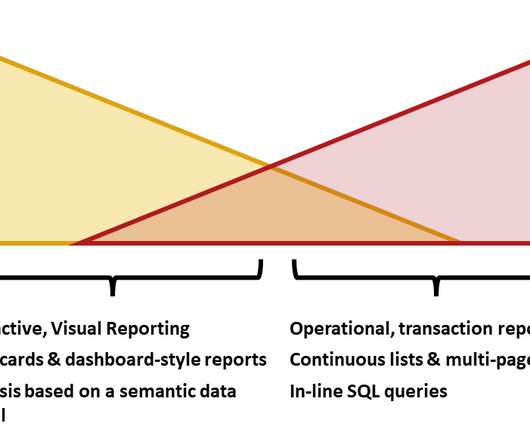
The road that has brought us to the current state of reporting capabilities in the Microsoft data platform has been long and winding. Ten years ago, we were using SQL Server Reporting Services (SSRS) to create interactive, dashboard-like reportsscorecardreports. It wasn’t … Continue reading →
As important parts of business intelligence, scorecard and dashboard can both play an obvious role in promoting enterprise development. However, limited by factors such as cost and corporate strategies, sometimes companies need to make a choice between scorecard vs dashboard. Definition of scorecard and dashboard. Free trial.
As important parts of business intelligence, scorecards and dashboards can both play an obvious role in promoting enterprise performance management. However, many users are confused with the difference between scorecard vs. dashboard. Definition of scorecard and dashboard. What is a scorecard? Main purpose.
Table of Contents 1) What Is The Report Definition? 2) Top 14 Types Of Reports 3) What Does A Report Look Like? Businesses have been producing reports since, forever. This presents a problem for many modern organizations today as building reports can take from hours to days. What Is The Report Definition?
To make the most out of your social media dashboards, you need to have an established process before you generate reports and utilize your online data visualization. Social media KPI scorecard. Our third social media reporting dashboard shows the business side of networking online. How To Create A Social Media Dashboard?
Every Analysis Ninja knows that standard reports are lame. Custom reports on the other hand are, well, hand crafted by you for a specific purpose with a set of guiding principles (" Acquisition, Behavior, Outcomes! ") that ensure that they don't so much deliver data as much as deliver insights.
In a world where we are overwhelmed with data and metrics and key performance indicators and reports and dashboards and. To share with you three custom reports that I find to be super valuable when I am doing web data analysis. I love custom reports. 1: Page Efficiency Analysis Report. Consider yourself fully forewarned!
User interfaces for ERP reporting tools are most often built with IT staff in mind, not the end user. Such is the case with Oracle Discoverer, one of the primary reporting tools in the Oracle ecosystem. Real-Time Reporting Solutions for Oracle EBS. Oracle’s 2014 Statement of Direction laid out its support strategy.
This report outlines the combination of traditional decision automation tools with machine learning models and other technologies. As Forrester notes in the report, many organizations are eager to harness the power of AI but also must be cautious of risks.
Five Reports and KPIs that deliver critical insights from ad blocking behavior. Reporting for the ad blocking behavior of your users won't automatically show up in Google Analytics. Go to any report in Google Analytics. Five Reports and KPIs that deliver critical insights from ad blocking behavior. Do I hear 80%?
An accounting department may consider leveraging electronic contracts, data collecting, and reporting as a part of the digital transition. Several marketing dashboard tools allow you to generate automated online dashboards and reports to track your most relevant KPIs in one place. Interactivity-driven Social Marketing.
Explore our modern reporting software for 14 days, completely free! Monitor trends: Comparing information with your past performance or setting a KPI scorecard template that you can translate to multiple business scenarios about your inventory measures and metrics will help you spot trends or inefficiencies in your processes.
Power BI’s rich reports or dashboards can be embedded into reporting portals you already use. Its dashboards, reports, and visualizations go far beyond bar and pie charts, but you don’t need to be a designer to create them.
An extraordinary amount of time, effort, $$$ are spent on building dashboards/scorecards for CMOs… Yet, the end result, nearly always, is a useless data puke. Personal Bias: I prefer the word Scorecard over Dashboard. In my writing, in my keynotes, you’ll hear Scorecard. Application #1: Paid Media CMO Scorecard Module.
One way to do it is for me to just tell you what my top ten Google Analytics reports are that you could familiarize yourself with. report in Google Analytics below includes a small brain dump of quick insights I seek when I'm looking at that report. Sources Overview report. Landing Pages report.
Nearly three-quarters of midsize and large companies report having a PMO, according to the 2022 State of the Project Management Office report from PM Solutions, a project management services firm. Most importantly, perhaps, is its overarching responsibility, which is to ensure projects deliver value.
KPIs), success metrics, scorecards). When I first started at AOL, a friend of mine pointed to the dozens of reports flying around the organization and remarked (I paraphrase): "This many ’important’ metrics just indicates that nobody really understands this business." Here’s an analytics truism: everyone wants a dashboard (a.k.a.
This value is usually calculated on the basis of the significance of that page in the Goal Flow and can be viewed under the “Page Value” section of your Google Analytics traffic scorecard. Get Reports and Updates Delivered to Your Mail Inbox. However, extracting such reports can be a cumbersome and time-consuming task.
Moreover, BI platform allows users to customize dashboards, create beautiful data visualizations, build scorecards, and compare them with key performance indicators (KPIs). The examples of BI reports in this article are all built-in templates made by FineReport. Free Download. BI platform for Sales.
When it comes to data analysis, you are usually more likely to see me share guidance on advanced segmentation or custom reports or advanced social metrics or controlled experiments or economic value or competitive intelligence or web analytics maturity or one of an infinite number of difficult, if hugely rewarding, things. Ravaging data.
How you define, position, and report it will make all the difference. Cutting innovation can also have adverse effects on employee satisfaction since many employees join organizations in part for their innovative culture.
Additionally, a KPI scorecard focused on long term marketing goals can help even the busiest CMOs to periodically track the progress of the company’s promotional activities. Plus, our SQL reporting software accepts a wide range of inputs. 10 Benefits Of Dynamic Corporate Dashboards. 6) Easy-to-see KPIs drive performance.
We made use of the organisational balanced scorecard and the associated metrics tracked in our quarterly business performance reporting.” By using data insights from the quarterly business performance report, the CFO is made aware of situations where the organisation is not tracking towards goals.
As a result, most IT functions have seen budget increases, support for more staff, and higher involvement in shaping enterprise strategy , according to multiple reports. Consider the findings of a report from professional services firm Accenture.
When we conclude the series, we’ll share a homegrown tool, an environmental health scorecard, to monitor and manage the health of your environment. Where we can, we’ll include valuable links to step-by-step instructions to guide you through successful implementation.
For the last four years, a majority of CIOs have reported that their IT budgets rose compared to the year prior. You can use spend analysis software like AppZen or Jaggaer to show spending, generate easy-to-understand spend reports, and unify spend data from many sources into a single source of truth. Balance Agility with Insight.
These near-instant visuals can be shared with others inside of dashboards, scorecards, and one-pagers to explain key findings to our audiences. Explanatory data visualization is typically for others, like our supervisor, Board of Directors, or other stakeholder groups. What are some additional features of Excel that should be retired?
Or compressing my experience into custom reports and advanced segments I've shared. This gives Earth's residents almost all the reports we would like to look at, and hence do almost all the analysis you might want to do in your quest to become an Analysis Ninja. Play with Enhanced Ecommerce Reports. Another tip.
And they earned less due to lockdown regulations, with Oxfam International reporting that the pandemic cost women globally around US$800 billion in earnings. The goal may be to create clear scorecards for software developers, rather making sure that candidates have the skills and competencies that are needed by the team,” Sineke says.
Real-time OLAP Traditionally, OLAP datastores were designed for batch processing to serve internal business reports. These users often prefer to have direct access to the data and the ability to analyze it independently, without relying solely on scheduled updates or reports provided at fixed intervals.
To ensure you’re not turning down candidates from diverse backgrounds, Richard advised training interviewers to stay open-minded about how key competencies were gained, using a scorecard to structure the process (many teams use Greenhouse to create scorecards for each stage of the interview process).
Sunil: Monica, in today’s scenario, the organizations have scorecards to track KPIs across businesses, geographies, and functions through BI dashboards and Excel reports. How do you track and report the impact of these metrics on key business outcomes? So, what’s your take on this?
Regions affected by COVID 19 will report higher defaults. They will also need recalibrated scorecards post-COVID as the existing models will not hold. They will also need recalibrated scorecards post-COVID as the existing models will not hold. There might be compliance-based loan restructuring and moratoriums.
With the help of KPI reports , all of these targets can be visualized together to get a complete picture across departments. Continuing on the line of targets, a KPI scorecard like the one below is the perfect tool to put together an efficient picture of progress and the latest developments regarding your most relevant indicators.
“We’ve been lucky that our transformation of cyber happened with digital transformation, so the last two years we’ve talked a lot to the board about technology,” he says, adding that even as a non-executive member (he reports to head of supply chain), he’s been to the boardroom approximately 50 times during this period.
These definitions will become your scorecard, so it’s vital you make them measurable and feasible. Track & report progress. Once you start executing your action plan, it’s imperative that you regularly track and report progress. You should also make sure your plans are prioritised based on the value they deliver.
Thanks to The OLAP Report for lots of great market materials. Balanced scorecards, GIS, analytic apps, extranets. In honor of the video, which was based on Billy Joel’s We Didn’t Start the Fire , here’s my tribute to the business intelligence market. Note, I’m no poet and it’s Friday! Anybody want to shoot a video? “We
” This type of Analytics includes traditional query and reporting settings with scorecards and dashboards. FineReport FineReport is a powerful reporting and big data tool that adopts popular 3-tier architecture. The most distinct is its reporting capabilities. Top 10 Big Data Tools 1.
A February 2021 report by RMIT Online with Deloitte Access Economics claimed that Australia needs 156,000 new technology workers with 87% of jobs requiring digital skills. Lastly, we embed and track progress a part of a quarterly ‘whole of self’ scorecard,” he says.
As a concrete example, a business unit with an organization may be tasked with developing credit risk scorecard models to determine the likelihood of default of a loan applicant. BARC INDUSTRY ANALYST REPORT. Driving Innovation with AI: Getting Ahead with DataOps and MLOps. Download now.
Workday plans to embed Platfora technology into its technology foundation to complement existing operational reporting, dashboarding and scorecarding capabilities with Platfora’s ad hoc exploration features targeted specifically for Workday’s HR and Finance application customers.
Typical use cases for DynamoDB are an ecommerce application handling a high volume of transactions, or a gaming application that needs to maintain scorecards for players and games. It’s used by thousands of customers for mission-critical workloads.
We organize all of the trending information in your field so you don't have to. Join 42,000+ users and stay up to date on the latest articles your peers are reading.
You know about us, now we want to get to know you!
Let's personalize your content
Let's get even more personalized
We recognize your account from another site in our network, please click 'Send Email' below to continue with verifying your account and setting a password.


Let's personalize your content