This site uses cookies to improve your experience. To help us insure we adhere to various privacy regulations, please select your country/region of residence. If you do not select a country, we will assume you are from the United States. Select your Cookie Settings or view our Privacy Policy and Terms of Use.
Cookie Settings
Cookies and similar technologies are used on this website for proper function of the website, for tracking performance analytics and for marketing purposes. We and some of our third-party providers may use cookie data for various purposes. Please review the cookie settings below and choose your preference.
Used for the proper function of the website
Used for monitoring website traffic and interactions
Cookie Settings
Cookies and similar technologies are used on this website for proper function of the website, for tracking performance analytics and for marketing purposes. We and some of our third-party providers may use cookie data for various purposes. Please review the cookie settings below and choose your preference.
Strictly Necessary: Used for the proper function of the website
Performance/Analytics: Used for monitoring website traffic and interactions
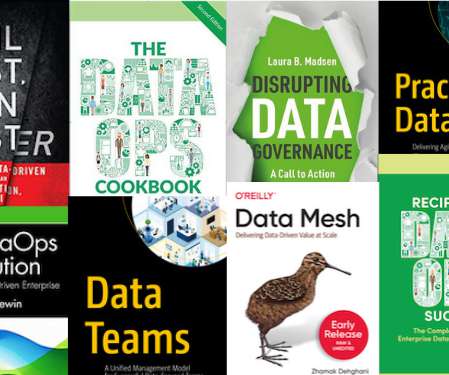
“Big data is at the foundation of all the megatrends that are happening.” – Chris Lynch, big data expert. We live in a world saturated with data. Zettabytes of data are floating around in our digital universe, just waiting to be analyzed and explored, according to AnalyticsWeek. Wondering which datascience book to read?
Back by popular demand, we’ve updated our data nerd Gift Giving Guide to cap off 2021. We’ve kept some classics and added some new titles that are sure to put a smile on your data nerd’s face. Fail Fast, Learn Faster: Lessons in Data-Driven Leadership in an Age of Disruption, Big Data, and AI, by Randy Bean.
Previously, we discussed the top 19 big data books you need to read, followed by our rundown of the world’s top business intelligence books as well as our list of the best SQL books for beginners and intermediates. Data visualization, or ‘data viz’ as it’s commonly known, is the graphic presentation of data.
Does data excite, inspire, or even amaze you? Do you find computer science and its applications within the business world more than interesting? How do you get into this field? What does a profession in this field look like? BI is a varied and expansive field, with many different areas to focus on or specialize in.
Through a visual designer, you can configure custom AI search flowsa series of AI-driven data enrichments performed during ingestion and search. The visual designer is recommended for helping you manage workflow projects. Each project contains at least one ingest or search flow.
The field of AI product management continues to gain momentum. As the AI product management role advances in maturity, more and more information and advice has become available. One area that has received less attention is the role of an AI product manager after the product is deployed. I/O validation.
For several years now, the elephant in the room has been that data and analytics projects are failing. Gartner estimated that 85% of big dataprojects fail. Add all these facts together, and it paints a picture that something is amiss in the data world. . Are they thriving or feeling the impact of failed projects?
Data sharing has become a crucial aspect of driving innovation, contributing to growth, and fostering collaboration across industries. According to this Gartner study , organizations promoting data sharing outperform their peers on most business value metrics. Data publishers : Users in producer AWS accounts.
Some call data the new oil. Philosophers and economists may argue about the quality of the metaphor, but there’s no doubt that organizing and analyzing data is a vital endeavor for any enterprise looking to deliver on the promise of data-driven decision-making. And to do so, a solid datamanagement strategy is key.
What is data analytics? One of the most buzzing terminologies of this decade has got to be “data analytics.” Companies generate unlimited data every day, and there is no end to the data collected over time. Companies need all of this data in a structured manner to improve their decision—making capabilities.
Certifications give your resume more credibility and can make you more marketable to recruiters and hiring managers. The follow-on Apple Deployment and Management course focuses on configuring, managing, and securing Apple products using mobile device management (MDM). before you can pass the exam.
“BI is about providing the right data at the right time to the right people so that they can take the right decisions” – Nic Smith. Data analytics isn’t just for the Big Guys anymore; it’s accessible to ventures, organizations, and businesses of all shapes, sizes, and sectors. They need to maximize their limited resources.
Predictive analytics definition Predictive analytics is a category of data analytics aimed at making predictions about future outcomes based on historical data and analytics techniques such as statistical modeling and machine learning. billion in 2022, according to a research study published by The Insight Partners in August 2022.
Task management applications are changing the way we manage teams. Here are some of the primary benefits of these task management applications : Task management tools improve team productivity. Task management tools make sure that teams operate more efficiently. Task management tools minimize worker stress.
In today’s data-driven landscape, managing and analyzing vast amounts of data, especially logs, is crucial for organizations to derive insights and make informed decisions. We recently announced a new capacity level of 30TB for time series data per account per AWS Region.
Read more about what personal and technical skills you should be looking for in a candidate in the following guide that New Millennia helped create. They have a greater level of independence regarding their duties and projects, which is highly productive and effective for the company. Personal Skills. Communication. Graphic Design.
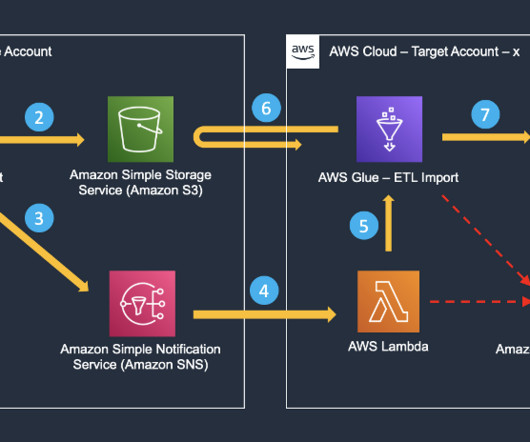
In this walkthrough, you will use a set of scripts to create the preceding architecture and data flow. You will execute scripts to create an AWS Identity and Access Management (IAM) role for invoking SageMaker, and a role for your user to create a connector to SageMaker. This post will guide you through running these scripts.
Can you deliver meaningful results on a dataproject within one or two quarters? That’s a requirement for nearly any initiative undertaken by Petco Chief Data and Analytics Officer Rakesh Srinivasan, who invests the talent and resources to achieve results quickly.
With this update, domain owners can define and enforce metadata requirements for data consumers when they request access to data assets. By making it mandatory for data consumers to provide specific metadata, domain owners can achieve compliance, meet organizational standards, and support audit and reporting needs.
In the past few years, the term “datascience” has been widely used, and people seem to see it in every field. Big Data”, “Business Intelligence”, “ Data Analysis ” and “ Artificial Intelligence ” came into being. For a while, everyone seems to have begun to learn data analysis. From Google. About thinking.
At Juice, we’ve helped our clients launch dozens of data products that generate new revenue streams, differentiate their solutions in the market and build stronger customer relationships. In this series I’ll take you through what you need to know to design, build, launch, sell and support a data product.
EA helps organizations structure IT projects and policies to achieve desired business results, to stay agile and resilient in the face of rapid change, and to stay on top of industry trends and disruptions using architecture principles and practices, a process also known as enterprise architectural planning (EAP).
Paco Nathan ‘s latest article covers program synthesis, AutoPandas, model-driven data queries, and more. In other words, using metadata about datascience work to generate code. In this case, code gets generated for data preparation, where so much of the “time and labor” in datascience work is concentrated.
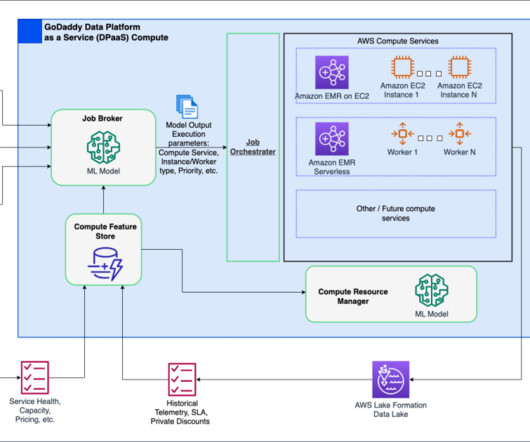
With more than 20 million customers worldwide, GoDaddy is the place people come to name their ideas, build a professional website, attract customers, and manage their work. At GoDaddy, we take pride in being a data-driven company. This methodology has become our guide in the pursuit of efficiency.
The decision to launch this pilot phase was driven by a desire to stay ahead in the field, assess the potential applications of gen AI, and subsequently transition into targeted proof-of-concept projects,” says Vlad-George Iacob, vice president of engineering at Hackajob.
Moreover, only 35% of LGBTQ+ and 41% of trans or GNC workers say they feel “represented in upper management at their company.” LGBTQ Tech LGBTQ Tech offers programs and resources to support LGBTQ+ communities and works to “educate organizations and policy makers on the unique needs LGBTQ+ individuals face when it comes to tech.”
Setting the record straight about the best program for transitioning to careers in data and tech New York Insight Fellows in June 2019 Over the past seven years, Insight has helped more than 2,000 Fellows transition into new careers in data and tech. 5 things to know about Insight (Spoiler: it’s not a bootcamp!)
Amir remembers seeing the projected light from the police flashers in the distance as he scooped up Hassan’s brother on the way to the car with his wife and the rest of his children. Partnering with Cloudera’s EMEA+ Employee Resource Groups (ERGs), they made it happen. Coming full circle: helping the forcibly displaced.
Paco Nathan ‘s latest monthly article covers Sci Foo as well as why datascience leaders should rethink hiring and training priorities for their datascience teams. In this episode I’ll cover themes from Sci Foo and important takeaways that datascience teams should be tracking. Introduction.
While the obvious link between the dinosaurs of the science fiction thriller Jurassic Park and the growing field of AI is a foundation in science, it is the cautionary tale relevant to both that captures our attention.
Data visualization techniques are paramount in today’s data-driven world. Mastering data visualization techniques is not just a skill but a necessity for professionals across various industries. Definition and Importance Visualizing data involves representing information through graphical elements like charts and graphs.
In Paco Nathan ‘s latest column, he explores the theme of “learning datascience” by diving into education programs, learning materials, educational approaches, as well as perceptions about education. He is also the Co-Chair of the upcoming DataScience Leaders Summit, Rev. Learning DataScience.
On Thursday January 6th I hosted Gartner’s 2022 Leadership Vision for Data and Analytics webinar. – In the webinar and Leadership Vision deck for Data and Analytics we called out AI engineering as a big trend. I would take a look at our Top Trends for Data and Analytics 2021 for additional AI, ML and related trends.
What is a Citizen Data Scientist, What is Their Role, What are the Benefits of Citizen Data Scientists…and More! The term, ‘Citizen Data Scientist’ has been around for a number of years. What is a Cititzen Data Scientist? Who is a Citizen Data Scientist? Since then, the idea has grown in popularity.
Learn Data Visualization Understanding the Importance of Visualizing DataData visualization is a powerful tool for conveying complex information in a clear and impactful manner. Whether it’s through charts, graphs, maps, or other visual formats, mastering data visualization is crucial for anyone working with data.
One key theme was the need for diversity and inclusion as a key part of the philosophy of a non-biased way of managing AI. That’s why we need people around us, to challenge us, to encourage us, and to help us to see the ‘data’ to guide us towards making better decisions and having a sustainable impact on our business.
With its leading cargo handling solutions and services, they are pioneers in their field. Cargotec captures terabytes of IoT telemetry data from their machinery operated by numerous customers across the globe. It reads the table and partition information from the source AWS Glue Data Catalog.
Are you interested in working on high-impact projects and transitioning to a career in data? Installing Spark from scratch and getting it to run in a distributed mode on a cloud computing system can be a hurdle for many new data engineers. All of the fields in the configuration files are described in the Readme.
The Core Responsibilities of the AI Product Manager. Product Managers are responsible for the successful development, testing, release, and adoption of a product, and for leading the team that implements those milestones. Product managers for AI must satisfy these same responsibilities, tuned for the AI lifecycle.
economy has ground to a halt, and social norms about our data and our privacy have been thrown out the window throughout much of the world. The most common types of AI systems are still only as good as their training data. These are unprecedented times, at least by information age standards. Much of the U.S. AI Is Different—Here’s Why.
In Paco Nathan ‘s latest column, he explores the role of curiosity in datascience work as well as Rev 2 , an upcoming summit for datascience leaders. Welcome back to our monthly series about datascience. and dig into details about where science meets rhetoric in datascience.
Software engineering made major breakthroughs two decades ago by applying reductionist techniques to project planning and management. Admittedly, throughout large swaths of computer science, reductionism serves quite well. The lens of reductionism and an overemphasis on engineering becomes an Achilles heel for datascience work.
Paco Nathan’s latest article covers data practices from the National Oceanic and Atmospheric Administration (NOAA) Environment DataManagement (EDM) workshop as well as updates from the AI Conference. DataScience meets Climate Science. Data veracity, data stewardship, and heros of datascience.
The saying “knowledge is power” has never been more relevant, thanks to the widespread commercial use of big data and data analytics. The rate at which data is generated has increased exponentially in recent years. Companies, both big and small, are seeking the finest ways to leverage their data into a competitive advantage.
We organize all of the trending information in your field so you don't have to. Join 42,000+ users and stay up to date on the latest articles your peers are reading.
You know about us, now we want to get to know you!
Let's personalize your content
Let's get even more personalized
We recognize your account from another site in our network, please click 'Send Email' below to continue with verifying your account and setting a password.


Let's personalize your content