This site uses cookies to improve your experience. To help us insure we adhere to various privacy regulations, please select your country/region of residence. If you do not select a country, we will assume you are from the United States. Select your Cookie Settings or view our Privacy Policy and Terms of Use.
Cookie Settings
Cookies and similar technologies are used on this website for proper function of the website, for tracking performance analytics and for marketing purposes. We and some of our third-party providers may use cookie data for various purposes. Please review the cookie settings below and choose your preference.
Used for the proper function of the website
Used for monitoring website traffic and interactions
Cookie Settings
Cookies and similar technologies are used on this website for proper function of the website, for tracking performance analytics and for marketing purposes. We and some of our third-party providers may use cookie data for various purposes. Please review the cookie settings below and choose your preference.
Strictly Necessary: Used for the proper function of the website
Performance/Analytics: Used for monitoring website traffic and interactions
Ten years have passed since artificial intelligence (AI) first appeared in sales technology, and the results are mixed. Forecast accuracy improved a little, but individual win rates did not change much. A buyers needs must intersect with a sellers solution, and any misalignment is rarely the fault of the product.
As someone deeply involved in shaping data strategy, governance and analytics for organizations, Im constantly working on everything from defining data vision to building high-performing data teams. But heres the question I keep asking myself: do we really need this immense power for most of our analytics? Theyre impressive, no doubt.
What success looks like can vary widely and range from reducing a call centers escalation rates, a food distributors sales order processing time, or a professional services companys new employee onboarding time, to an airline that personalizes customer communications or a media company that provides real-time language translation.
The first wave of generative artificial intelligence (GenAI) solutions has already achieved considerable success in companies, particularly in the area of coding assistants and in increasing the efficiency of existing SaaS products. However, these applications only show a small glimpse of what is possible with large language models (LLMs).
This spending on AI infrastructure may be confusing to investors, who won’t see a direct line to increased sales because much of the hyperscaler AI investment will focus on internal uses, he says. By 2026, hyperscalers will have spent more on AI-optimized servers than they will have spent on any other server until then, Lovelock predicts.
Exclusive Bonus Content: Ready to make analytics straightforward? Online dashboards provide immediate navigable access to actionable analytics that has the power to boost your bottom line through continual commercial evolution. A data dashboard assists in 3 key business elements: strategy, planning, and analytics.
For example, if I am searching for customer sales numbers, different datasets may label that “ sales ”, or “ revenue ”, or “ customer_sales ”, or “ Cust_sales ”, or any number of other such unique identifiers. The BI team may be focused on KPIs, forecasts, trends, and decision-support insights. What a nightmare that would be!
The rise of self-service analytics democratized the data product chain. Suddenly advanced analytics wasn’t just for the analysts. Businesses of all sizes are no longer asking if they need increased access to business intelligence analytics but what is the best BI solution for their specific business.
You can secure and centrally manage your data in the lakehouse by defining fine-grained permissions with Lake Formation that are consistently applied across all analytics and machine learning(ML) tools and engines. In this post, we demonstrate how to get started with ABAC in SageMaker Lakehouse and use with various analytics services.
1) What Is Business Intelligence And Analytics? If someone puts you on the spot, could you tell him/her what the difference between business intelligence and analytics is? We already saw earlier this year the benefits of Business Intelligence and Business Analytics. What Is Business Intelligence And Analytics?
Rather, an AI-native company blends and augments human teams creativity and innovation with AIs analytical power to improve collaboration, productivity and strategization. Start with the problem, not the solution AI is not a one-size-fits-all technology. Here are four steps to help you get started: 1.
Spreadsheets no longer provide adequate solutions for a serious company looking to accurately analyze and utilize all the business information gathered. One business report example can focus on finance, another on sales, the third on marketing. Operational optimization and forecasting. click to enlarge**. Cost optimization.
As the head of sales at your small company, you’ve prepared for this moment. “Mr. Download our free executive summary and boost your sales strategy! That’s why, in this post, we’re going to go over 16 sales graphs and charts that will fuel your imagination and give you some useful resources. 1) Sales Performance.
That being said, in this post, we will explain what is a dashboard in business, the features of strategic, tactical, operational and analytical dashboards, and expound on examples that these different types of dashboards can be used. The sales performance dashboard above is a one-stop-shop for sales insights. Let’s get started.
These analytical tools allow decision-makers to get a sense of their performance in a number of areas and extract valuable insights to inform their future strategies and boost growth. A performance report is an analytical tool that offers a visual overview of how a business is performing in a specific strategy, project, or department.
Try our modern logistics analytics software for 14 days, completely free! The metrics can be utilized in the inventory accuracy and turnover metrics, to the inventory-to-sales ratio. Days Sales Outstanding (DSO). Try our modern logistics analytics software for 14 days, completely free! Supply Chain Costs vs. Sales.
Productivity can be measured in many different ways and at different levels, from the raw industrial output of an asset in a manufacturing facility to the specific individual sales performance of a vendor. Sales goals and profit margins are all performance metrics examples that businesses reference, but it goes much deeper than that.
times compared to 2023 but forecasts lower increases over the next two to five years. What to bet on : Look for scalable departmental opportunities with complex business rules embedded in document processing and a mix of no-code, low-code, RPA, and BPO solutions in place.
Moreover, within just five years, the number of smart connected devices in the world will amount to more than 22 billion – all of which will produce colossal sets of collectible, curatable, and analyzable data, claimed IoT Analytics in their industry report. Sales Target. Sales performance dashboard. What does this mean?
One of the most important is collecting revenue data to draft financial statements, forecast future sales and make decisions to address revenue shortfalls. These factors are why companies will spend over $12 billion on data analytics for marketing solutions by 2027. Report on SalesForecasts.
A differentiating characteristic of these reports is their objectivity, they are only meant to inform but not propose solutions or hypotheses. With this information in hand, businesses can build strategies based on analytical evidence and not simple intuition. Let’s look at it with an analytical report example.
Predictive analytics definition Predictive analytics is a category of data analytics aimed at making predictions about future outcomes based on historical data and analytics techniques such as statistical modeling and machine learning. from 2022 to 2028. As such it can help adopters find ways to save and earn money.
For some, leveraging data and analytics tools is proving to be an effective way to address the challenges. But the latest analytics tools, powered by machine learning algorithms, can help companies predict demand more effectively, enabling them to adjust production and shipping operations.
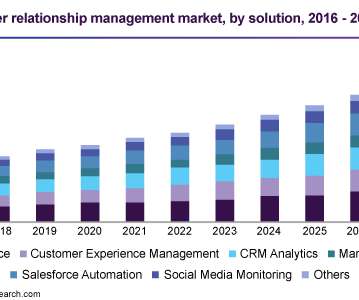
These software tools rely on sophisticated big data algorithms and allow companies to boost their sales, business productivity and customer retention. It has solutions that help organizations teams to work and manage business operations efficiently from anywhere in the world. billion in 2020 and is expected to reach USD 47.6
Using these automated systems and AI robot machines , companies are better able to meet their sales goals. Smart Sales Predictions. One-way artificial intelligence is changing the industry is by providing smarter sales predictions. These smart sales predictions utilize AI to secure your supply chain.
What are predictive analytics tools? Predictive analytics tools blend artificial intelligence and business reporting. But there are deeper challenges because predictive analytics software can’t magically anticipate moments when the world shifts gears and the future bears little relationship to the past. Highlights. Deployment.
4) How to Select Your KPIs 5) Avoid These KPI Mistakes 6) How To Choose A KPI Management Solution 7) KPI Management Examples Fact: 100% of statistics strategically placed at the top of blog posts are a direct result of people studying the dynamics of Key Performance Indicators, or KPIs. Table of Contents 1) What Is KPI Management?
1 But despite some of the benefits of online sales, this isn’t all good news for retailers. Online shopping can cut into impulse purchases — which are typically higher-margin sales — because 82% of impulsive purchase decisions are made in a brick-and-mortar store. and order value by 61% while reducing returns by 40%.
Analytics is becoming more important than ever in the world of business. Over 70% of global businesses use some form of analytics. For both reasons, the role of CIOs has to embrace automation and analytical thinking in strategizing the organization’s initiatives. They are using analytics to help drive business growth.
With the “big data” or insurmountable, high-volume amount of information, data analytics plays a crucial role in many business aspects, including revenue marketing. Data analytics refers to the systematic computational analysis of statistics or data. When companies use data analytics, the processing of data is lightning fast.
Did you know that 53% of companies use data analytics technology ? Machine Learning Helps Companies Get More Value Out of Analytics. There are a lot of benefits of using analytics to help run a business. You will get even more value out of analytics if you leverage machine learning at the same time.
Sales operates on one system, finance on another, and operations on its own platform. Beyond Data Collection: Why Dynamics 365 Integration is Critical Most businesses today use Dynamics 365 for managing sales, finance, customer service, or operations. Because data without intelligence is just noise.
While they are connected and cannot function without each other, as mentioned earlier, BI is mainly focused on generating business insights, whether operational or strategic efficiency such as product positioning and pricing to goals, profitability, sales performance, forecasting, strategic directions, and priorities on a broader level.
Overstocking can lead to increased holding costs and waste, while understocking can result in lost sales, reduced customer satisfaction, and damage to the business’s reputation. Forecasting is another critical component of effective inventory management. The following diagram illustrates a sample architecture.
The point of such dashboards is not to simplify the working environment and analysis processes since there are massive volumes of data collected on a daily level, and companies need solutions that will bring them to the right answer at the right time. 6) Chart Zoom. Data visualization is the easiest way to surface data irregularities.
NetSuite is adding generative AI and a host of new features and applications to its cloud-based ERP suite in an effort to compete better with midmarket rivals including Epicor, IFS, Infor, and Zoho in multiple domains such as HR, supply chain, banking, finance, and sales.
-based company, which claims to be the top-ranked supplier of renewable energy sales to corporations, turned to machine learning to help forecast renewable asset output, while establishing an automation framework for streamlining the company’s operations in servicing the renewable energy market.
Does it make sense to have a complete separation between your company goals, sales reps targets, and compensation models? In this blog post, we’ll look at how you connect the dots between Sales Performance Management and xP&A. What is Sales Performance Management? Connecting the dots.
Modern chemistry delvers solutions and revolutionary products, and Clariant supports global production in everything from home care to vehicles, energy, electronics, mining, agriculture, and cosmetics – even your kid’s brightly colored toys (with safe, stable paint) to the stain-trapping polymers that protect their favorite Star Wars t-shirts.
If there are sales, the management needs to know exactly how much product was sold today, how much last month, how much more or less compared to last year. In fact, the entire analytical reporting of the companies is based on the multi-dimensional data operated by BI. Companies in a variety of sectors are turning to BI-based solutions.
Data analytics and visualization help with many such use cases. Here is where data analytics and visualization come into play. While most people are unfamiliar with these terms, investing in data analytics and visualization can mean the difference between success and failure. What Is Data Analytics?
There are many reasons that data analytics and data mining are vital aspects of modern e-commerce strategies. These benefits include the following: You can use data analytics to better understand the preferences of your users and provide personalized product recommendations.
What is business analytics? Business analytics is the practical application of statistical analysis and technologies on business data to identify and anticipate trends and predict business outcomes. What are the benefits of business analytics? What is the difference between business analytics and data analytics?
What is data analytics? Data analytics is a discipline focused on extracting insights from data. The chief aim of data analytics is to apply statistical analysis and technologies on data to find trends and solve problems. What are the four types of data analytics?
We organize all of the trending information in your field so you don't have to. Join 42,000+ users and stay up to date on the latest articles your peers are reading.
You know about us, now we want to get to know you!
Let's personalize your content
Let's get even more personalized
We recognize your account from another site in our network, please click 'Send Email' below to continue with verifying your account and setting a password.


Let's personalize your content