This site uses cookies to improve your experience. To help us insure we adhere to various privacy regulations, please select your country/region of residence. If you do not select a country, we will assume you are from the United States. Select your Cookie Settings or view our Privacy Policy and Terms of Use.
Cookie Settings
Cookies and similar technologies are used on this website for proper function of the website, for tracking performance analytics and for marketing purposes. We and some of our third-party providers may use cookie data for various purposes. Please review the cookie settings below and choose your preference.
Used for the proper function of the website
Used for monitoring website traffic and interactions
Cookie Settings
Cookies and similar technologies are used on this website for proper function of the website, for tracking performance analytics and for marketing purposes. We and some of our third-party providers may use cookie data for various purposes. Please review the cookie settings below and choose your preference.
Strictly Necessary: Used for the proper function of the website
Performance/Analytics: Used for monitoring website traffic and interactions
Applying statistical analysis to data and getting insights from it is our main objective. The post Statistical Inference Using Python appeared first on Analytics Vidhya. Data science is an emerging technology in the corporate society and it mainly deals with the data. A company wil store millions of records for analysis. A […].
The post Statistics for Data Science appeared first on Analytics Vidhya. ArticleVideo Book This article was published as a part of the Data Science Blogathon. It is the mark of truly intelligent person to be.
Statistics is the grammar of Science. The post Statistics and Probability Concepts for Data Science appeared first on Analytics Vidhya. ArticleVideo Book This article was published as a part of the Data Science Blogathon. – Karl Pearson What.
ArticleVideo Book This article was published as a part of the Data Science Blogathon Introduction Statistics is a subject that really matters a lot in. The post Basic Statistics Concepts for Machine Learning Newbies! appeared first on Analytics Vidhya.
Speaker: John Mecke, Managing Director of DevelopmentCorporate, Jon Gatrell, Principal Partner at Market Driven Business
The ability to express complex concepts in numerical, financial, or statistical terms is critical, but it is often an overlooked discipline. In today’s Agile world, product managers are expected to be leaders in market knowledge, strategy, organizational enablement, etc. Numerical literacy is a key skill for effective product managers.
Introduction One of the most important applications of Statistics is looking into how two or more variables relate. The post Statistical Effect Size and Python Implementation appeared first on Analytics Vidhya. Hypothesis testing is used to look if there is any significant relationship, and we report it using a p-value.
Introduction How much data is enough to state statistical significance? The post Statistics for Beginners: Power of “Power Analysis” appeared first on Analytics Vidhya. This article was published as a part of the Data Science Blogathon.
A fundamental understanding of statistical tests is necessary to derive insights from any data. Whether you’re analyzing customer behavior, optimizing algorithms, […] The post 5 Statistical Tests Every Data Scientist Should Know appeared first on Analytics Vidhya.
Introduction Instead of starting with the definition of statistics, I. The post Statistical Analysis of Data for Data Scientists appeared first on Analytics Vidhya. ArticleVideo Book This article was published as a part of the Data Science Blogathon.
Examining five years of anonymous data from over 6 million users in 170+ countries, Spigit has discovered that a culture of innovation can be measured – with a 99% statistical confidence level – by a metric called "ideation rate." Download the eBook now for an in-depth look at this groundbreaking study.
Introduction Hypothesis testing is one of the most important techniques applied in various fields such as statistics, economics, pharmaceutical, mining and manufacturing industries. The post Hypothesis Testing in Inferential Statistics appeared first on Analytics Vidhya.
This article was published as a part of the Data Science Blogathon Introduction to StatisticsStatistics is a type of mathematical analysis that employs quantified models and representations to analyse a set of experimental data or real-world studies. Data processing is […].
The post Statistics 101: Beginners Guide to Continuous Probability Distributions appeared first on Analytics Vidhya. ArticleVideos This article was published as a part of the Data Science Blogathon. Introduction In the previous post, we have defined Probability Distributions and briefly.
Introduction The role of statistics in the dynamic field of data science is foundational, acting as the critical toolset for analyzing and making sense of the vast data landscapes of today. With countless resources at our disposal, selecting the right guide to navigate the intricate world of statistics can be overwhelming.
Speaker: M.K. Palmore, VP Field CSO (Americas), Palo Alto Networks
He will use a combination of industry insights through statistical observations and direct customer feedback to emphasize the importance of adopting new technologies to battle an ever changing threat landscape. In this webinar, you will learn: The future of data security.
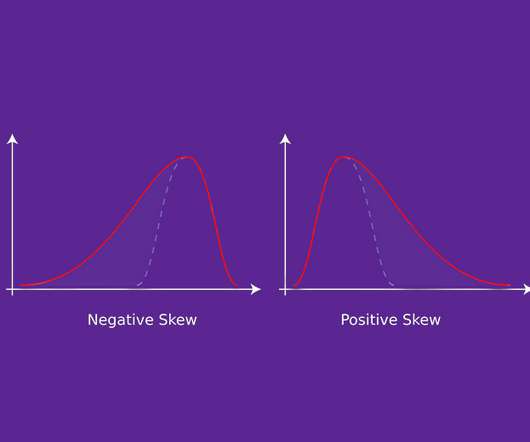
Overview Skewness is a key statistics concept you must know in the data science and analytics fields Learn what is skewness, the formula for. The post Statistics for Data Science: What is Skewness and Why is it Important? appeared first on Analytics Vidhya.
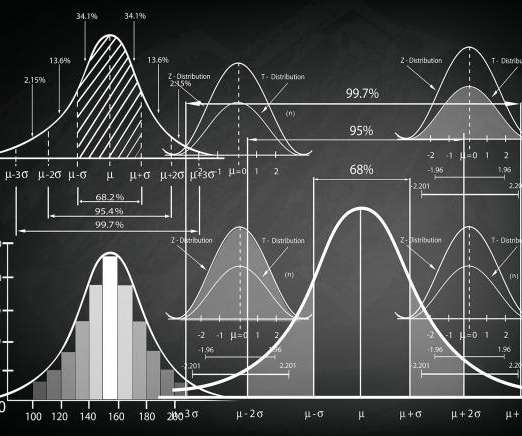
The post Empirical Rule in Gaussian distribution in Statistics appeared first on Analytics Vidhya. ArticleVideo Book This article was published as a part of the Data Science Blogathon Introduction This article is based on the very famous and important.
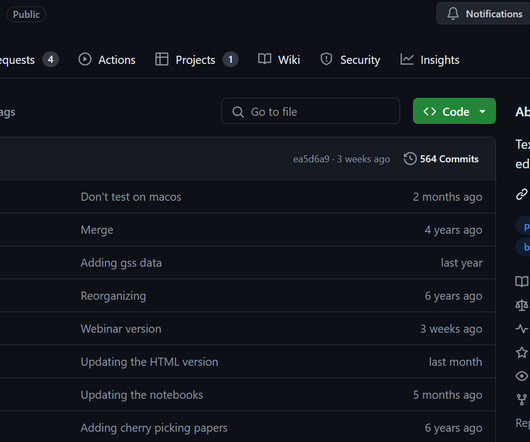
Introduction Statistics is a cornerstone of data science, machine learning, and many analytical domains. GitHub hosts numerous repositories that are excellent resources for anyone looking to deepen their statistical knowledge. Mastering it can significantly enhance your ability to interpret data and make informed decisions.
The post An Introduction to Statistics For Data Science: Basic Terminologies Explained appeared first on Analytics Vidhya. ArticleVideo Book This article was published as a part of the Data Science Blogathon. Are you an aspiring data scientist who wants to learn.
This playbook contains: Exclusive statistics, research, and insights into how the pandemic has affected businesses over the last 18 months. We’ve created this interactive playbook to help you use your data to provide actionable insights that will lead to better business decisions and customer outcomes.
The post A Guide To Complete Statistics For Data Science Beginners! ArticleVideo Book This article was published as a part of the Data Science Blogathon Source Introduction: In this article, we will learn all the important. appeared first on Analytics Vidhya.
Introduction As Josh Wills once said, “A Data Scientist is a person who is better at statistics than any programmer and better at programming than any statistician“ Statistics is a fundamental tool when dealing with data and its analysis in Data Science. It provides […].
The post Traversing the Trinity of Statistical Inference Part 2: Confidence Intervals appeared first on Analytics Vidhya. ArticleVideo Book This article was published as a part of the Data Science Blogathon Introduction This is the second article of the series on ‘Traversing.
The post Intermediate Statistical Concepts for Data Science Beginners! ArticleVideo Book This article was published as a part of the Data Science Blogathon Introduction Hello all, In this tutorial, we will cover some Intermediate. appeared first on Analytics Vidhya.
Introduction Statistical models are significant for understanding and predicting complex data. A viable area for statistical modeling is time-series analysis. Statistical models […] The post Learning Time Series Analysis & Modern Statistical Models appeared first on Analytics Vidhya.
Introduction Statistical Analysis of text is one of the important steps of text pre-processing. The pyNLPL […] The post Textual Statistical Analysis Using pyNLPL (Pineapple) Library appeared first on Analytics Vidhya. It helps us understand our text data in a deep, mathematical way.
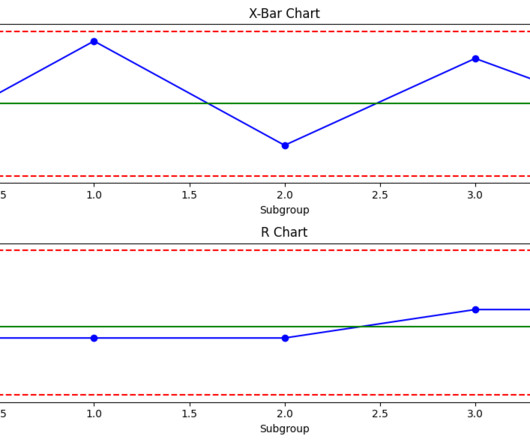
Introduction In quality management, Statistical Process Control (SPC) charts are the key for organizations to help oversee, control, and improve their processes. Through statistical methods, SPC charts highlight variations and identify patterns to ensure consistent product quality. Overview What are SPC Charts?
Businesses and governments extensively use data to make essential choices […] The post Difference Between Data Science vs Statistics appeared first on Analytics Vidhya. A growing need for data science roles in various fields has led to the masses opting for specialized degrees and training programs in data science.
Introduction At the heart of data science lies statistics, which has existed for centuries yet remains fundamentally essential in today’s digital age. Because basic statistics concepts are the backbone of data analysis, enabling us to make sense of the vast amounts of data generated daily.
One such module is the statistics module, which provides a comprehensive set of functions for statistical operations. Introduction Python is a powerful programming language that offers a wide range of modules for various applications.
Introduction Statistical analysis means investigating trends, patterns, and relationships using quantitative data. To draw valid results, statistical analysis requires planning from the start of the research process. It is a crucial research tool used by scientists, governments, businesses, and other organizations.
Statistics involves gathering and organizing raw data into an easily understandable format. There are two broad categories of statistical methods: descriptive and inferential statistics. This article will explain the difference between descriptive vs inferential statistics. appeared first on Analytics Vidhya.
Introduction Statistics is not limited to academic or specific profession. No matter whether you need to study data sciexnce, do some research or just try to handle the information about yourself, you need to understand statistics.
Introduction Statistical analysis plays a crucial role in the fast-developing field of data science, enabling researchers to gain insightful knowledge from data. This article compares frequentist vs […] The post Frequentist vs Bayesian Statistics in Data Science appeared first on Analytics Vidhya.
Whether you’re delving into descriptive statistics, probability distributions, or sophisticated regression models, R’s versatility and extensive packages facilitate seamless statistical exploration. R, an open-source tool, empowers data enthusiasts to explore, analyze, and visualize data with precision.
A key idea in data science and statistics is the Bernoulli distribution, named for the Swiss mathematician Jacob Bernoulli. It is crucial to probability theory and a foundational element for more intricate statistical models, ranging from machine learning algorithms to customer behaviour prediction.
While Pandas’ describe() function has been a go-to tool for many, its functionality is limited to numeric data and provides only basic statistics. Data summarization is an essential first step in any data analysis workflow.
Probability is a cornerstone of statistics and data science, providing a framework to quantify uncertainty and make predictions. Understanding joint, marginal, and conditional probability is critical for analyzing events in both independent and dependent scenarios. This article unpacks these concepts with clear explanations and examples.
The normal distribution, also known as the Gaussian distribution, is one of the most widely used probability distributions in statistics and machine learning. Understanding its core properties, mean and variance, is important for interpreting data and modelling real-world phenomena.
As indicated in machine learning and statistical modeling, the assessment of models impacts results significantly. Accuracy falls short of capturing these trade-offs as a means to work with imbalanced datasets, especially in terms of precision and recall ratios.
Table of contents Introduction Confidence Intervals with Z-statistic Interpreting Confidence Intervals Assumptions for CI using z-statistic Confidence intervals with t-statistic Assumptions for CI using t-statistic Making a t-interval with paired data z-value vs t-value: when to use what?
Introduction to Random Forest Missing values have always been a concern for any statistical analysis. They significantly reduce the study’s statistical powers, which may lead to faulty conclusions. Most of the algorithms used in statistical modellings such as Linear regression, Logistic Regression, […].
Introduction Hey, are you working on a data science project, solving a problem statement related to data science, or experimenting with a statistical test to make further decisions and handling the most repeatedly cited statistical term, ‘correlation’? Willing to correctly interpret these statistical […].
Regression analysis is used to solve problems of prediction based on data statistical parameters. In this article, we will look at the use of a polynomial regression model on a simple example using real statistic data. This article was published as a part of the Data Science Blogathon.
We organize all of the trending information in your field so you don't have to. Join 42,000+ users and stay up to date on the latest articles your peers are reading.
You know about us, now we want to get to know you!
Let's personalize your content
Let's get even more personalized
We recognize your account from another site in our network, please click 'Send Email' below to continue with verifying your account and setting a password.


Let's personalize your content