This site uses cookies to improve your experience. To help us insure we adhere to various privacy regulations, please select your country/region of residence. If you do not select a country, we will assume you are from the United States. Select your Cookie Settings or view our Privacy Policy and Terms of Use.
Cookie Settings
Cookies and similar technologies are used on this website for proper function of the website, for tracking performance analytics and for marketing purposes. We and some of our third-party providers may use cookie data for various purposes. Please review the cookie settings below and choose your preference.
Used for the proper function of the website
Used for monitoring website traffic and interactions
Cookie Settings
Cookies and similar technologies are used on this website for proper function of the website, for tracking performance analytics and for marketing purposes. We and some of our third-party providers may use cookie data for various purposes. Please review the cookie settings below and choose your preference.
Strictly Necessary: Used for the proper function of the website
Performance/Analytics: Used for monitoring website traffic and interactions
ArticleVideo Book This article was published as a part of the Data Science Blogathon Introduction In applied Statistics and Machine Learning, DataVisualization is one. The post Must Known DataVisualization Techniques for Data Science appeared first on Analytics Vidhya.
This article was published as a part of the Data Science Blogathon. The post Interpreting P-Value and R Squared Score on Real-Time Data – StatisticalData Exploration appeared first on Analytics Vidhya. Overview In this article, I will share my thoughts on the below.
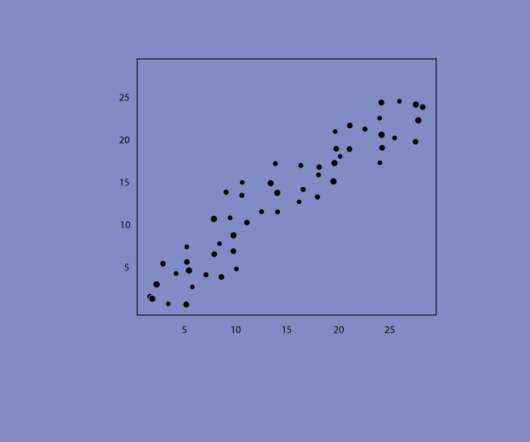
This article was published as a part of the Data Science Blogathon. Introduction Have you ever been tasked with visualizing the relationship between each. The post Creating Linear Model, It’s Equation and Visualization for Analysis appeared first on Analytics Vidhya.
ArticleVideos Image by Author In statistics, correlation or dependence is any statistical relationship, whether causal or not, between two random variables or bivariate data. The post Using Predictive Power Score to Pinpoint Non-linear Correlations appeared first on Analytics Vidhya.
They can also automate report generation and interpret data nuances that traditional methods might miss. Imagine generating complex narratives from datavisualizations or using conversational BI tools that respond to your queries in real time. Tableau, Qlik and Power BI can handle interactive dashboards and visualizations.
ArticleVideo Book This article was published as a part of the Data Science Blogathon Introduction Many engineers have never worked in statistics or data science. The post Know the basics of Exploratory Data Analysis appeared first on Analytics Vidhya.
In a world increasingly dominated by data, users of all kinds are gathering, managing, visualizing, and analyzing data in a wide variety of ways. One of the downsides of the role that data now plays in the modern business world is that users can be overloaded with jargon and tech-speak, which can be overwhelming.
An analytical report is a type of a business report that uses qualitative and quantitative company data to analyze as well as evaluate a business strategy or process while empowering employees to make data-driven decisions based on evidence and analytics.
Preview of Amazon SageMaker Unified Studio Amazon SageMaker Unified Studio is an integrated data and AI development environment that enables collaboration and helps teams build data products faster. We enhanced support for querying Apache Iceberg data and improved the performance of querying Iceberg up to threefold year-over-year.
They emphasize access to and manipulation of large databases of structureddata, often a time-series of internal company data and sometimes external data. Commonly used models include: Statistical models. It features support for creating and visualizing decision tree–driven customer interaction flows.
Using techniques from a range of disciplines, including computer programming, mathematics, and statistics, data analysts draw conclusions from data to describe, predict, and improve business performance. Data analyst role Data analysts mostly work with an organization’s structureddata.
Computer Vision: Data Mining: Data Science: Application of scientific method to discovery from data (including Statistics, Machine Learning, datavisualization, exploratory data analysis, experimentation, and more). NLG is a software process that transforms structureddata into human-language content.
The next generation of SageMaker also introduces new capabilities, including Amazon SageMaker Unified Studio (preview) , Amazon SageMaker Lakehouse , and Amazon SageMaker Data and AI Governance. Now, the Data Catalog lets you generate statistics automatically for new tables with one-time catalog configuration.
Most commonly, we think of data as numbers that show information such as sales figures, marketing data, payroll totals, financial statistics, and other data that can be counted and measured objectively. This is quantitative data. It’s “hard,” structureddata that answers questions such as “how many?”
In today’s data-driven world, the datavisualization specialist plays a pivotal role in transforming complex information into visually appealing formats. The demand for skilled professionals in this field is rapidly increasing as businesses rely more on data for decision-making and operations.
Over the decade’s Hospitality Industry wings expand to the new horizon due to the widespread usage of mobiles which allows customers to plan the vacation & visualize the ambiance at their fingertips. Text analytics helps to draw the insights from the unstructured data. .
The post A Comprehensive Step-by-Step Guide to Become an Industry Ready Data Science Professional appeared first on Analytics Vidhya. ArticleVideo Book Introduction to Artificial Intelligence and Machine Learning Artificial Intelligence (AI) and its sub-field Machine Learning (ML) have taken the world by storm.
Though you may encounter the terms “data science” and “data analytics” being used interchangeably in conversations or online, they refer to two distinctly different concepts. Meanwhile, data analytics is the act of examining datasets to extract value and find answers to specific questions.
If you are considering a Business Intelligence solution, you ought to give some consideration to the concept of Smart DataVisualization and review your prospective solution to determine its capabilities in that regard. How do users perceive and use data? How do formats and reporting affect a user’s understanding of data?
Operations data: Data generated from a set of operations such as orders, online transactions, competitor analytics, sales data, point of sales data, pricing data, etc. The gigantic evolution of structured, unstructured, and semi-structureddata is referred to as Big data.
ArticleVideo Book This article was published as a part of the Data Science Blogathon Introduction Exploratory data analysis is an approach to analyzing data sets. The post Exploratory Data Analysis : A Beginners Guide To Perform EDA appeared first on Analytics Vidhya.
The post A Comprehensive Step-by-Step Guide to Become an Industry-Ready Data Science Professional appeared first on Analytics Vidhya. Introduction to Artificial Intelligence and Machine Learning Artificial Intelligence (AI) and its sub-field Machine Learning (ML) have taken the world by storm.
The traditional data science workflow , as defined by Joe Blitzstein and Hanspeter Pfister of Harvard University, contains 5 key steps: Ask a question. Get the data. Explore the data. Model the data. Communicate and visualize the results. A data catalog can assist directly with every step, but model development.
A common pitfall in the development of data platforms is that they are built around the boundaries of point solutions and are constrained by the technological limitations (e.g., a technology choice such as Spark Streaming is overly focused on throughput at the expense of latency) or data formats (e.g.,
The features you or your company need are core factors influencing your selection of the data analytics tool. For example, if you want the features of datavisualization , such as stunning dashboards and rich charts, business intelligence tools are more suitable for you than a pure programming tool. Free Download. From FineBI.
Over the decade’s Hospitality Industry wings expand to the new horizon due to the widespread usage of mobiles which allows customers to plan the vacation & visualize the ambiance at their fingertips. Text analytics helps to draw the insights from the unstructured data.
A data catalog is a central hub for XAI and understanding data and related models. While “operational exhaust” arrived primarily as structureddata, today’s corpus of data can include so-called unstructured data. How Data Lineage Is a Use Case in ML. Other Technologies.
Recent statistics shed light on the realities in the world of current drug development: out of about 10,000 compounds that undergo clinical research, only 1 emerges successfully as an approved drug. The current process involves costly wet lab experiments, which are often performed multiple times to achieve statistically significant results.
How can he make it easy to see statistics, and do calculations, on discovered commonalities, across structured and unstructured data? How can users drill down, in non-technical ways, to quickly interact with data that explains what correlations seem to matter?
Every user can now create interactive reports and utilize datavisualization to disseminate knowledge to both internal and external stakeholders. A business intelligence dashboard, also known as a BI dashboard, is a tool that presents important business metrics and data points in a visual and analytical format on a single screen.
However, due to regulatory controls on sensitive data like phone numbers and technical challenges in cross-platform integration of Internet and mobile reporting data, our current matching rates are relatively low, reaching around 20% in ideal scenarios, excluding telecom data. We assess revenue streams.
AI-powered parsing models detect complex format inconsistencies across structured and semi-structureddata. Real-World Example A senior data engineer at a SaaS company leverages an AI-powered format validation tool to ensure that CSV-to-JSON conversions preserve numeric precision. typos in addressfields).
There are essentially four types encountered: image/video, audio, text, and structureddata. Note how model visualization is bubbling up to the top, which has implications for model interpretability, cyber threats, etc. AI tech startups selling capabilities into enterprise, please take note. will not save you there.
We also asked what kinds of data our “mature” respondents are using. Most (83%) are using structureddata (logfiles, time series data, geospatial data). form data). We’d expect most business applications to involve structureddata, form data, or text data of some kind.
Real-Time Analytics Pipelines : These pipelines process and analyze data in real-time or near-real-time to support decision-making in applications such as fraud detection, monitoring IoT devices, and providing personalized recommendations. For example, migrating customer data from an on-premises database to a cloud-based CRM system.
We organize all of the trending information in your field so you don't have to. Join 42,000+ users and stay up to date on the latest articles your peers are reading.
You know about us, now we want to get to know you!
Let's personalize your content
Let's get even more personalized
We recognize your account from another site in our network, please click 'Send Email' below to continue with verifying your account and setting a password.


Let's personalize your content