This site uses cookies to improve your experience. To help us insure we adhere to various privacy regulations, please select your country/region of residence. If you do not select a country, we will assume you are from the United States. Select your Cookie Settings or view our Privacy Policy and Terms of Use.
Cookie Settings
Cookies and similar technologies are used on this website for proper function of the website, for tracking performance analytics and for marketing purposes. We and some of our third-party providers may use cookie data for various purposes. Please review the cookie settings below and choose your preference.
Used for the proper function of the website
Used for monitoring website traffic and interactions
Cookie Settings
Cookies and similar technologies are used on this website for proper function of the website, for tracking performance analytics and for marketing purposes. We and some of our third-party providers may use cookie data for various purposes. Please review the cookie settings below and choose your preference.
Strictly Necessary: Used for the proper function of the website
Performance/Analytics: Used for monitoring website traffic and interactions
In the previous century, we finally had the technology to […]. The post Using Data Visualization to Explore the Human Space Race! Since the dawn of civilization, we have mapped constellations, named planets after Gods and so on. We have seen signs and visions in celestial bodies. appeared first on Analytics Vidhya.
Microsoft Research Asia has taken this technology a step further by introducing VisualGPT. This AI model incorporates Visual […] The post Microsoft Releases VisualGPT: Combines Language and Visuals appeared first on Analytics Vidhya.
Introduction Setting up a development environment is not easy if you are inexperienced, especially if a lot of technologies you wish to learn are. The post Docker-based Python Development with CUDA Support on PyCharm and/or Visual Studio Code appeared first on Analytics Vidhya.
This experience includes visual ETL, a new visual interface that makes it simple for data engineers to author, run, and monitor extract, transform, load (ETL) data integration flow. You can use a simple visual interface to compose flows that move and transform data and run them on serverless compute. Now you can publish it.
Think your customers will pay more for data visualizations in your application? But today, dashboards and visualizations have become table stakes. Five years ago they may have. Discover which features will differentiate your application and maximize the ROI of your embedded analytics. Brought to you by Logi Analytics.
Google Lookout’s latest breakthrough in accessibility technology has introduced a new feature called ‘Image Question and Answer.’ ’ This innovation is poised to transform the way individuals with visual impairments or low vision interact with the world around them.
Introduction DreamFusion, the revolutionary AI-driven technology capable of converting text into 3D visuals using 2D diffusion techniques, has recently been honored with the prestigious Best Paper Award at ICLR-2023.
Introduction In today’s competitive world of technology, it is very crucial for. The post A Hands-On Guide to Building a Visual Similarity-Based Recommendation System using Python appeared first on Analytics Vidhya. This article was published as a part of the Data Science Blogathon.
Now that you’re sold on the power of data analytics in addition to data-driven BI, it’s time to take your journey a step further by exploring how to effectively communicate vital metrics and insights in a concise, inspiring, and accessible format through the power of visualization. That’s a colossal number of books on visualization.
Speaker: Marius Moscovici, CEO Metric Insights & Mike Smitheman, VP Metric Insights
To be effective, Business Intelligence (BI) governance must cover both data and visualizations. Technology - The essential components required in your technology stack. Organizations continually fail to generate ROI on their governance initiatives because they are too narrow in scope.
From OpenAI’s o1 models showcasing advanced reasoning to Apple’s groundbreaking Visual Intelligence technology, tech giants like Google, Meta, and Microsoft have introduced new models and tools pushing the boundaries of AI innovation.
This transformation requires a fundamental shift in how we approach technology delivery moving from project-based thinking to product-oriented architecture. They require fundamentally reimagining how we approach enterprise architecture and technology delivery. The stakes have never been higher.
“By visualizing information, we turn it into a landscape that you can explore with your eyes. 90% of the information transmitted to the brain is visual. Data visualization methods refer to the creation of graphical representations of information. That’s where data visualization comes in. A sort of information map.
In this post, we’re going to give you the 10 IT & technology buzzwords you won’t be able to avoid in 2020 so that you can stay poised to take advantage of market opportunities and new conversations alike. Exclusive Bonus Content: Download our Top 10 Technology Buzzwords! One of the IT buzzwords you must take note of in 2020.
Speaker: Dr. Joe Perez, Senior Systems Analyst at NC Dept. of Health & Human Services, and Chief Technology Officer at SolonTek
Join Dr. Joe Perez, Senior Systems Analyst at NC DHHS, and Chief Technology Officer, SolonTek, to learn how you can capitalize on your ideas by blending internal with external while leveraging them into a cohesive strategy for both the short term and the long term. Determine how to leverage these steps into a cohesive visualization strategy.
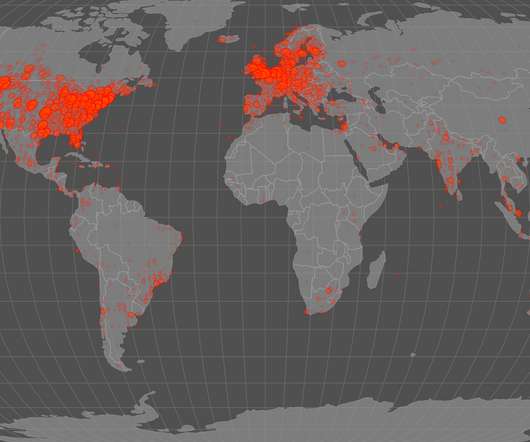
This surge in internet penetration underscores the pervasive influence […] The post 20 Technologies in Data Science for Professionals appeared first on Analytics Vidhya. As of January 2024, 5.35 billion individuals were connected to the Internet, constituting 66.2 percent of the world’s population.
This integration enables our customers to seamlessly explore data with AI in Tableau, build visualizations, and uncover insights hidden in their governed data, all while leveraging Amazon DataZone to catalog, discover, share, and govern data across AWS, on premises, and from third-party sources—enhancing both governance and decision-making.”
This article was published as a part of the Data Science Blogathon Introduction Dash is an open-source web framework for creating analytical dashboards and data visualizations. Dash constitutes of three technologies: 1. It helps data analysts to deploy dashboards and serve these dashboards to the main web application.
OpenAI’s Spring Update event is abuzz with excitement as Chief Technology Officer Mira Murati revealed three new updates. Firstly, she announced the much-awaited GPT-4o, promising enhanced text, visual, and audio capabilities to ChatGPT. The second update revealed a desktop version of the model with an improved UI/UX design.
Speaker: Anthony Roach, Director of Product Management at Tableau Software, and Jeremiah Morrow, Partner Solution Marketing Director at Dremio
Tableau works with Strategic Partners like Dremio to build data integrations that bring the two technologies together, creating a seamless and efficient customer experience. A self-service platform for data exploration and visualization that broadens access to analytic insights. A seamless and efficient customer experience.
The AI enables more natural interactions with devices by converting visual elements into text, thereby transforming user experience. Let us explore this new technology and also find out how it compares with existing models such […] The post Apple Launches ReALM Model that Outperforms GPT-4 appeared first on Analytics Vidhya.
Introduction GhostFaceNets is a revolutionary facial recognition technology that uses affordable operations without compromising accuracy. Inspired by attention-based models, it revolutionizes facial recognition technology.
Google has unveiled its latest breakthrough in the world of fashion & technology: a cutting-edge virtual try-on (VTO) feature for apparel. This innovative tool leverages artificial intelligence (AI) to provide users with realistic visualization of how clothes would look on models with diverse body shapes and sizes.
In this exciting exploration of artificial intelligence (AI) in spreadsheet software, we will explore the fascinating intersection of technology and data manipulation. As Excel continues to evolve, integrating AI features has become a game-changer, revolutionizing how we analyze, visualize, and interpret information.
Artificial intelligence algorithms, which power some of technology’s most cutting-edge applications, such as producing logical stretches of text or creating visuals from descriptions, may need massive amounts of computational power to train. There are immense computational costs of Deep Learning and AI. This, in […].
Amazon DataZone recently announced the expansion of data analysis and visualization options for your project-subscribed data within Amazon DataZone using the Amazon Athena JDBC driver. When you’re connected, you can query, visualize, and share data—governed by Amazon DataZone—within Tableau. Connect with him on LinkedIn.
Finally, we will show you a real-life example so you can get a visual overview and a clearer picture of the points discussed in this article. Here are the key benefits of CRM dashboards, tools, and technologies: Decision-making: CRM reporting will help you make swifter, more informed decisions while creating digestible, ‘at a glance’ data.
But in order for AI to expand, we need new networking technology that boosts transmission speeds and improves responsiveness. IOWN is a communication infrastructure that uses optical and photonic technologies to deliver ultra-high-capacity, ultra-low-latency and ultra-low-power communications. The answer? Learn more about IOWN here.
Introduction AI and machine vision, which were formerly considered futuristic technology, has now become mainstream, with a wide range of applications ranging from automated robot assembly to automatic vehicle guiding, analysis of remotely sensed images, and automated visual inspection. Computer vision and deep learning […].
Technological progress has enabled the customization of these codes, transforming the once mundane black-and-white arrangement of dots into visually appealing designs inspired by various patterns and images. QR codes have widespread popularity, particularly for their convenience in payments.
As I recently pointed out, process mining has emerged as a pivotal technology for data-driven organizations to discover, monitor and improve processes through use of real-time event data, transactional data and log files. Organizations use it to better understand the current state of systems and business processes.
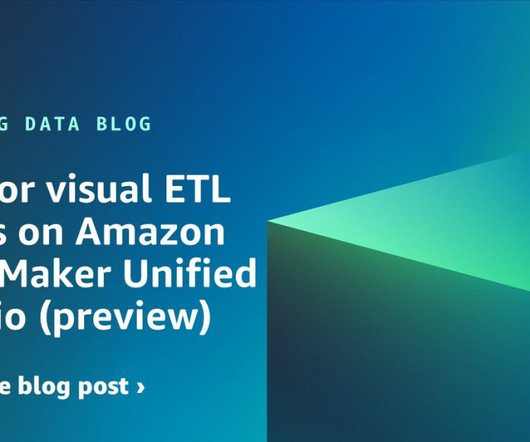
These improvements are available through the Amazon Q chat experience on the AWS Management Console , and the Amazon SageMaker Unified Studio (preview) visual ETL and notebook interfaces. The DataFrame code generation now extends beyond AWS Glue DynamicFrame to support a broader range of data processing scenarios.
Data science tools are essential in many facets of the profession, from data collection and preprocessing to analysis and visualization. […] The post Top 5 AI Tools for Data Science Professionals appeared first on Analytics Vidhya. As data volumes grow, the significance of data science tools becomes increasingly pronounced.
Imagine generating complex narratives from data visualizations or using conversational BI tools that respond to your queries in real time. Tableau, Qlik and Power BI can handle interactive dashboards and visualizations. Typically, the initial excitement about the latest and greatest technology can blind us to practical considerations.
Creating and visualizing 3D models has been made more accurate, accessible, and efficient through high-powered AI 3D object generators. Whether you’re a graphic designer or a game developer, it depends on your requirements as to which AI 3D object generators might be the best one for you.
Amazon Managed Service for Apache Flink Studio notebooks seamlessly combine these technologies to make advanced analytics on data streams accessible to developers of all skill sets. Amazon Managed Service for Apache Flink Studio uses Apache Zeppelin as the notebook, and uses Flink as the stream processing engine.
BI projects aren’t just for the big fishes in the sea anymore; the technology has developed rapidly, the software has become more accessible while business intelligence and analytics projects implemented in various industries regularly, no matter the shape and size, small businesses or large enterprises.
Spreadsheets finally took a backseat to actionable and insightful data visualizations and interactive business dashboards. Companies are no longer wondering if data visualizations improve analyses but what is the best way to tell each data-story. 2) Data Discovery/Visualization. Data exploded and became big.
These updates have added several new features that are set to make searching and browsing more visual, intuitive, and powerful. In a recent announcement, Microsoft has unveiled massive updates to its Edge and Bing Chat features, signaling a new era in the search engine’s capabilities.
We are excited to announce the preview of API-driven, OpenLineage-compatible data lineage in Amazon DataZone to help you capture, store, and visualize lineage of data movement and transformations of data assets on Amazon DataZone. The lineage visualized includes activities inside the Amazon DataZone business data catalog.
Its code generation architecture uses a visual interface to create Java or SQL code. Talend data integration software offers an open and scalable architecture and can be integrated with multiple data warehouses, systems and applications to provide a unified view of all data.
In an innovative leap for visual content creation, Getty Images and Nvidia have joined forces to introduce Generative AI by iStock, an innovative text-to-image platform. This collaborative effort seeks to empower both individuals and businesses with an affordable and commercially safe solution for generating unique stock photos.
Data dashboards provide a centralized, interactive means of monitoring, measuring, analyzing, and extracting a wealth of business insights from relevant datasets in several key areas while displaying aggregated information in a way that is both intuitive and visual. Lack of different data visualization types.
One of the most remarkable manifestations of AI is the emergence of AI video generators, which have seamlessly bridged the gap between text and visuals, revolutionizing content creation.
We organize all of the trending information in your field so you don't have to. Join 42,000+ users and stay up to date on the latest articles your peers are reading.
You know about us, now we want to get to know you!
Let's personalize your content
Let's get even more personalized
We recognize your account from another site in our network, please click 'Send Email' below to continue with verifying your account and setting a password.


Let's personalize your content