This site uses cookies to improve your experience. To help us insure we adhere to various privacy regulations, please select your country/region of residence. If you do not select a country, we will assume you are from the United States. Select your Cookie Settings or view our Privacy Policy and Terms of Use.
Cookie Settings
Cookies and similar technologies are used on this website for proper function of the website, for tracking performance analytics and for marketing purposes. We and some of our third-party providers may use cookie data for various purposes. Please review the cookie settings below and choose your preference.
Used for the proper function of the website
Used for monitoring website traffic and interactions
Cookie Settings
Cookies and similar technologies are used on this website for proper function of the website, for tracking performance analytics and for marketing purposes. We and some of our third-party providers may use cookie data for various purposes. Please review the cookie settings below and choose your preference.
Strictly Necessary: Used for the proper function of the website
Performance/Analytics: Used for monitoring website traffic and interactions
Dean Boyer as a guest to the Jedox Blog for our series on “Managing Uncertainty” Mr. Boyer is a Director of Technology Services at Marks Paneth LLP, a premier accounting firm based in the United States. He shares his expertise on how an EPM solution supports managing economic uncertainty, particularly in times of crisis.
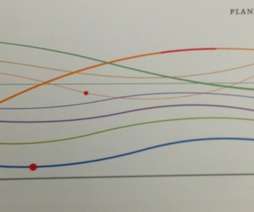
A Fan Chart is a visualisation tool used in time series analysis to display forecasts and associated uncertainties. Each shaded area shows the range of possible future outcomes and represents different levels of uncertainty with the darker shades indicating higher levels of probability.
This is due, on the one hand, to the uncertainty associated with handling confidential, sensitive data and, on the other hand, to a number of structural problems. A central measure here is the definition and visualization of control and monitoring key figures.
Dean Boyer as a guest to the Jedox Blog for our series on “Managing Uncertainty” Mr. Boyer is a Director of Technology Services at Marks Paneth LLP, a premier accounting firm based in the United States. He shares his expertise on how an EPM solution supports managing economic uncertainty, particularly in times of crisis.
From Edward Tufte's Visual Explanations, a diagram based on Salman Rushdie‘s description of the Indian epid Kathasaritsagara or Ocean of the Streams of Story. The hot new concept in data visualization is "data storytelling"; some are calling it the next evolution of visualization (I'm one of them).
With advanced analytics, flexible dashboarding and effective data visualization, FP&A storytelling has become both an art and science. First, because uncertainty exploded. I’ve worked with hundreds of dashboard and data visualization projects over the years. Dashboards and analytics have been around for a long, long time.
A DSS supports the management, operations, and planning levels of an organization in making better decisions by assessing the significance of uncertainties and the tradeoffs involved in making one decision over another. It features support for creating and visualizing decision tree–driven customer interaction flows. Parmenides Edios.
The uncertainty of not knowing where data issues will crop up next and the tiresome game of ‘who’s to blame’ when pinpointing the failure. Given this, it’s crucial to have in Place meticulous testing protocols for the results of models, visualizations, data delivery mechanisms, and overall data utilization.
But we’re moving back to a world that’s digitally analog, with things like big data visualization. And they introduced this idea, the VUCA world: Volatile, Uncertainty, Complex, and Ambiguous. The good news is we have all these tools for data visualization and volumes of data—about our own bodies—to help us make healthier choices.
The lack of data utilization is happening even though 80% of the leaders said that data is critical to decision making and 73% said that data reduces uncertainties. Salesforce acquired visual analytics software provider Tableau in August 2019.
Uncertainty & Error. Charts used to communicate and/or analyse the range of error or uncertainty within a dataset. Also known as “multi-variate analysis” or “multi-dimensional analysis” Chernoff Faces. Parallel Coordinates. Radar Chart. Ternary Graph. Area Bands. Confidence Strips. Error Bars.
Without visualized analytics, it was difficult to bridge the void between expectation and accurate analysis. The objectives were lofty: integrated, scalable, and replicable enterprise management; streamlined business processes; and visualized risk control, among other aims, all fully integrating finance, logistics, production, and sales.
We wanted to include interactive, real-time visualizations to support recruiters from one of our government clients. Our previous solution offered visualization of key metrics, but point-in-time snapshots produced only in PDF format.
Do we all share the same doubts and uncertainties about life decisions? These are the reasons why we created a data visualization platform that makes text and images first-class elements in data storytelling. Take a listen: The theme of this song is universal — you don’t need to be a Steve to feel it. Am I making the most of my life?
In these times of great uncertainty and massive disruption, is your enterprise data helping you drive better business outcomes? Enable navigable data intelligence visualizations and governed feedback loops. Provide visibility into data quality and proven “golden sources”.
This certainly applies to data visualization, which unfortunately lends itself to a great deal of noise if we’re not careful and skilled. Every choice that we make when creating a data visualization seeks to optimize the signal-to-noise ratio. No accurate item of data, in and of itself, always qualifies either as a signal or noise.
It’s about being comfortable with uncertainty, like a sailor who trusts their ability to navigate through uncharted waters. Yes, we know it’s really challenging, but through visualizing and predicting change, you’ll be primed when the time comes to pivot and go again. Where you can, try to predict change.
You will always face uncertainty and unexpected challenges. Either way, you will have to face uncertainty. Since childhood, Alana knew she wanted to do some form of visual storytelling – whether via film, television, or theater. “My Uncertainty will always be uncomfortable. This is a fact in work and life.
If you describe the dimensions and features you want to include in your deck, the application can offer visualization tools and design aids. He specializes in removing fear, uncertainty, and doubt from strategic decision-making through empirical data and market sensing. But it can do much more.
Coming out of more than a year of change and uncertainty, there’s one thing we know for sure — the stage has been set for profound transformation and enduring positive change. It is remarkable how picture books shine at the twin arts of visual and textual storytelling. But we need more visual literacy.
Be it in the form of online BI tools , or an online data visualization system, a company must address where and how to store its data. To mitigate the various risks and uncertainties in transitioning to the cloud, IT must adapt its traditional IT control processes to include the cloud. It’s completely free!
Drive insight with data-driven visualization. And visualization tools help us to make sense of the vast amount of data we have collected: a visual dashboard assists management, supporting rapid and accurate decision-making concerning the business. Start with a transformative vision.
This he’s just one of the many ways that artificial intelligence has significantly improved outcomes that rely on visual media. Address their questions and clarify any uncertainties promptly. This helps ensure consistency among annotators and identifies areas of ambiguity in guidelines that need improvement.
As quantitative data is always numeric, it’s relatively straightforward to put it in order, manage it, analyze it, visualize it, and do calculations with it. These programs and systems are great at generating basic visualizations like graphs and charts from static data. The challenge comes when the data becomes huge and fast-changing.
It’s multidimensional, so to understand accuracy holistically, you need to evaluate it through multiple tools and visualizations. Recognizing and admitting uncertainty is a major step in establishing trust. Accuracy — this refers to a subset of model performance indicators that measure a model’s aggregated errors in different ways.
If you really want to wow your users, get a platform that allows you to implement custom visuals and functionality with your analytics. He brings with him a proven track record of creating innovative, sustainable solutions to the product life cycle, development, and customers, despite the uncertainty and challenges that may arise.
Alternately, they can condense data into sophisticated visualizations that give important context and expose truth from different angles. Does it involve more work than you’d like and create more uncertainty than you can accept? 7 Steps to Building your Single Source of Truth. 7 Steps to Building your Single Source of Truth.
Therefore, bootstrapping has been promoted as an easy way of modelling uncertainty to hackers who don’t have much statistical knowledge. Don’t compare confidence intervals visually. Confidence intervals are a common way of quantifying the uncertainty in an estimate of a population parameter.
Robotic process automation is one example in which money may be wasted when the company could have gotten the same results using Visual Basic and Excel macros, to be quite honest. How can businesses deal with the economic uncertainties of the pandemic and protect their companies? What do accountants need to do to become CFOs?
Typically, causal inference in data science is framed in probabilistic terms, where there is statistical uncertainty in the outcomes as well as model uncertainty about the true causal mechanism connecting inputs and outputs. Our code has details (there are probably other reasonable visualization approaches that work just as well).
These circumstances have induced uncertainty across our entire business value chain,” says Venkat Gopalan, chief digital, data and technology officer, Belcorp. “As To address the challenges, the company has leveraged a combination of computer vision, neural networks, NLP, and fuzzy logic.
In a world marked by volatility, uncertainty, complexity, and ambiguity (VUCA) building a holistic planning environment is inevitable for successful steering.” The platform’s proactive monitoring, intuitive interface and data visualization capabilities ensure prompt issue detection and resolution.
In a world that’s still recovering from the impact of a pandemic, facing economic uncertainties, geopolitical crises, and extreme climate change—all of which disrupt traditional value chains—the need for enterprise-scale transformation is a key imperative for global business.
Forecasting acts as a planning tool to help enterprises prepare for the uncertainty that can occur in the future. to create forecast tables and visualize the data. Time series data is plottable on a line graph and such time series graphs are valuable tools for visualizing the data.
Data processing and visualization. label="uncertainty"). This could very well be carried out using any CDP based Spark application like Zeppelin, Spark shell, Hue etc. All of them do work out of the box with Ozone. In our example, we demonstrated a couple of queries that show the trend of vaccinations per country.
Often, teams are held back by the limitations of existing enterprise resource planning (ERP) systems reports, which require support from IT to customize, or they rely on business intelligence (BI) and analytics tools, which do not provide users a no-code experience to build reports and visualizations with drill-down.
Uncertainty is expected and complexity is compounding. To meet these objectives, business and data professionals need to go beyond cookie-cutter business intelligence, data visualization dashboards and data analytics tools. As threats materialize on multiple fronts, organizations must reduce the time from insight to action.”
How can I visualize my career development? He specializes in removing fear, uncertainty, and doubt from strategic decision-making through empirical data and market sensing. How can I continue to work on it?” I could also have an assistant that helps me map my professional development. Artificial Intelligence, Machine Learning
Do we all share the same doubts and uncertainties about life decisions? These are the reasons why we created a data visualization platform that makes text and images first-class elements in data storytelling. Take a listen: The theme of this song is universal — you don’t need to be a Steve to feel it. Am I making the most of my life?
Much of the financial reporting process, including data collection, integration, analysis, and visualization, can now run on autopilot. Decision makers were looking for a dynamic and detailed perspective into the data, and instead, they got something that only inspired uncertainty. The difference is subtle, but significant.
The path to Citizen Data Scientist does not have to be fraught with uncertainty.’. The path to Citizen Data Scientist does not have to be fraught with uncertainty. If you are a team member in a business environment, your role within that business is unique. Why is it important to implement a Citizen Data Scientist Program?
Although Microsoft’s rollout of its two ERP cloud products (D365 F&SCM, and for smaller businesses, D365 Business Central) has been going on for some time, the current climate of economic uncertainty has prompted a lot of companies to hit the pause button on migration, choosing instead to stay the course with their existing Dynamics AX systems.
Government executives face several uncertainties as they embark on their journeys of modernization. Throughout the visual representation of the journey, pain points are plotted accordingly.
And we could easily visualize how a fix could impact our warranty claim forecast. Here at Skullcandy, we’re happy to report that “dropping in” to the predictive and sentiment analytics game was worth the initial uncertainty. Full circle data experience: achieved. Lessons Learned.
We organize all of the trending information in your field so you don't have to. Join 42,000+ users and stay up to date on the latest articles your peers are reading.
You know about us, now we want to get to know you!
Let's personalize your content
Let's get even more personalized
We recognize your account from another site in our network, please click 'Send Email' below to continue with verifying your account and setting a password.


Let's personalize your content