This site uses cookies to improve your experience. To help us insure we adhere to various privacy regulations, please select your country/region of residence. If you do not select a country, we will assume you are from the United States. Select your Cookie Settings or view our Privacy Policy and Terms of Use.
Cookie Settings
Cookies and similar technologies are used on this website for proper function of the website, for tracking performance analytics and for marketing purposes. We and some of our third-party providers may use cookie data for various purposes. Please review the cookie settings below and choose your preference.
Used for the proper function of the website
Used for monitoring website traffic and interactions
Cookie Settings
Cookies and similar technologies are used on this website for proper function of the website, for tracking performance analytics and for marketing purposes. We and some of our third-party providers may use cookie data for various purposes. Please review the cookie settings below and choose your preference.
Strictly Necessary: Used for the proper function of the website
Performance/Analytics: Used for monitoring website traffic and interactions
ArticleVideo Book This article was published as a part of the Data Science Blogathon Introduction Sounds can become wrangled within the data science field through. The post Visualizing Sounds Using Librosa Machine Learning Library! appeared first on Analytics Vidhya.
With organizations seeking to become more data-driven with business decisions, IT leaders must devise data strategies gear toward creating value from data no matter where — or in what form — it resides. Unstructureddata resources can be extremely valuable for gaining business insights and solving problems.
They promise to revolutionize how we interact with data, generating human-quality text, understanding natural language and transforming data in ways we never thought possible. From automating tedious tasks to unlocking insights from unstructureddata, the potential seems limitless. And guess what?
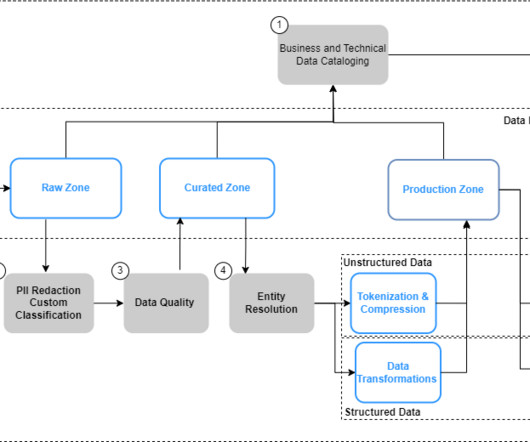
This article was published as a part of the Data Science Blogathon. Introduction A data lake is a central data repository that allows us to store all of our structured and unstructureddata on a large scale. The post A Detailed Introduction on Data Lakes and Delta Lakes appeared first on Analytics Vidhya.
Unstructureddata is information that doesn’t conform to a predefined schema or isn’t organized according to a preset data model. Unstructured information may have a little or a lot of structure but in ways that are unexpected or inconsistent. Text, images, audio, and videos are common examples of unstructureddata.
Introduction Textual data from social media posts, customer feedback, and reviews are valuable resources for any business. There is a host of useful information in such unstructureddata that we can discover. Making sense of this unstructureddata can help companies better understand […].
Introduction Text Mining is also known as Text Data Mining or Text Analytics or is an artificial intelligence (AI) technology that uses natural language processing (NLP) to extract essential data from standard language text. It is a process to transform the unstructureddata (text […].
There are countless examples of big data transforming many different industries. It can be used for something as visual as reducing traffic jams, to personalizing products and services, to improving the experience in multiplayer video games. We would like to talk about datavisualization and its role in the big data movement.
From our release of advanced production machine learning features in Cloudera Machine Learning, to releasing CDP Data Engineering for accelerating data pipeline curation and automation; our mission has been to constantly innovate at the leading edge of enterprise data and analytics.
In a world increasingly dominated by data, users of all kinds are gathering, managing, visualizing, and analyzing data in a wide variety of ways. One of the downsides of the role that data now plays in the modern business world is that users can be overloaded with jargon and tech-speak, which can be overwhelming.
Data dashboards provide a centralized, interactive means of monitoring, measuring, analyzing, and extracting a wealth of business insights from relevant datasets in several key areas while displaying aggregated information in a way that is both intuitive and visual. Data being spread out amongst many databases.
The human brain processes visualdata better than any other kind of data, which is good because about 90% of the information our brains process is visual. Visual processing and responses both occur more quickly compared to other stimuli. This where the power of visualizations is apparent.
Introduction Document information extraction involves using computer algorithms to extract structured data (like employee name, address, designation, phone number, etc.) from unstructured or semi-structured documents, such as reports, emails, and web pages.
Different types of information are more suited to being stored in a structured or unstructured format. Read on to explore more about structured vs unstructureddata, why the difference between structured and unstructureddata matters, and how cloud data warehouses deal with them both. Unstructureddata.
What is DataVisualization? Datavisualization provides clear, fast and effective communication according to graphical means. From the user’s point of view, datavisualization allows users to quickly grasp the key points of information, which can help them make better and wiser decisions. Innovation.
In many cases, this eliminates the need for specialized teams, extensive data labeling, and complex machine-learning pipelines. The extensive pre-trained knowledge of the LLMs enables them to effectively process and interpret even unstructureddata. and immediately receive relevant answers and visualizations.
Content includes reports, documents, articles, presentations, visualizations, video, and audio representations of the insights and knowledge that have been extracted from data. We could further refine our opening statement to say that our business users are too often in a state of being data-rich, but insights-poor, and content-hungry.
Data science has become an extremely rewarding career choice for people interested in extracting, manipulating, and generating insights out of large volumes of data. To fully leverage the power of data science, scientists often need to obtain skills in databases, statistical programming tools, and datavisualizations.
With the growth of business data, it is no longer surprising that AI has penetrated data analytics and business insight tools. Business insight and data analytics landscape. Artificial intelligence and allied technologies make business insight tools and data analytics software more efficient.
Exciting and futuristic, the concept of computer vision is based on computing devices or programs gaining the ability to extract detailed information from visual images. Visual analytics: Around three million images are uploaded to social media every single day. Artificial Intelligence (AI).
DataOps needs a directed graph-based workflow that contains all the data access, integration, model and visualization steps in the data analytic production process. It orchestrates complex pipelines, toolchains, and tests across teams, locations, and data centers. Meta-Orchestration .
They also face increasing regulatory pressure because of global data regulations , such as the European Union’s General Data Protection Regulation (GDPR) and the new California Consumer Privacy Act (CCPA), that went into effect last week on Jan. So here’s why data modeling is so critical to data governance.
Data monitoring has been changing the business landscape for years now. That said, it hasn’t always been that easy for businesses to manage the huge amounts of unstructureddata coming from various sources. By the time a report is ready, the data has already lost its value due to the fast-paced nature of today’s context.
To date, however, enterprises’ vast troves of unstructureddata – photo, video, text, and more – have remained mostly untapped. At DataRobot, we are acutely aware of the ability of diverse data to create vast improvements to our customers’ business. Today, managing unstructureddata is an arduous task. Jared Bowns.
Artificial intelligence (AI) is the analytics vehicle that extracts data’s tremendous value and translates it into actionable, usable insights. In my role at Dell Technologies, I strive to help organizations advance the use of data, especially unstructureddata, by democratizing the at-scale deployment of artificial intelligence (AI).
DataRobot’s Visual AI models in autopilot built a model with an improved 1 percent better performance without any additional parameter tuning. Since the ease of adding unstructureddata to tabular dataset and modeling is quite easy with DataRobot, the improvement in performance was achieved with minimal effort. Request a Demo.
Considered a new big buzz in the computing and BI industry, it enables the digestion of massive volumes of structured and unstructureddata that transform into manageable content. Visual analytics tools empower business users to perform these actions in a graphic manner, without needing to learn complicated query languages such as SQL.
Data mining and knowledge go hand in hand, providing insightful information to create applications that can make predictions, identify patterns, and, last but not least, facilitate decision-making. Working with massive structured and unstructureddata sets can turn out to be complicated. It’s much easier to work with graphs.
This significantly reduces the amount of time needed to engage in data science tasks. A text analytics interface that helps derive actionable insights from unstructureddata sets. A datavisualization interface known as SPSS Modeler. Neptune.ai. You can easily integrate the hardware accelerator with other tools.
At Atlanta’s Hartsfield-Jackson International Airport, an IT pilot has led to a wholesale data journey destined to transform operations at the world’s busiest airport, fueled by machine learning and generative AI. He is a very visual person, so our proof of concept collects different data sets and ingests them into our Azure data house.
What is data science? Data science is a method for gleaning insights from structured and unstructureddata using approaches ranging from statistical analysis to machine learning. Tableau: Now owned by Salesforce, Tableau is a datavisualization tool.
Data architect role Data architects are senior visionaries who translate business requirements into technology requirements and define data standards and principles, often in support of data or digital transformations. In some ways, the data architect is an advanced data engineer.
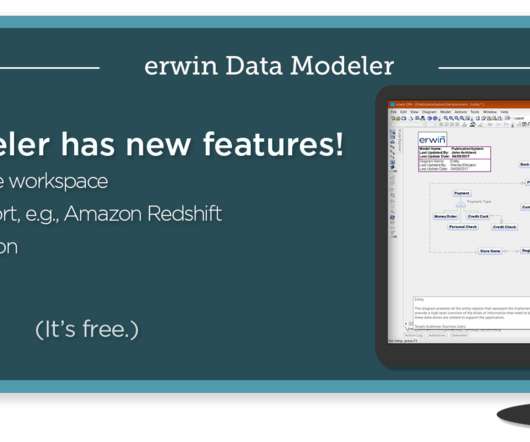
What is Data Modeling? Data modeling is a process that enables organizations to discover, design, visualize, standardize and deploy high-quality data assets through an intuitive, graphical interface. Data models provide visualization, create additional metadata and standardize data design across the enterprise.
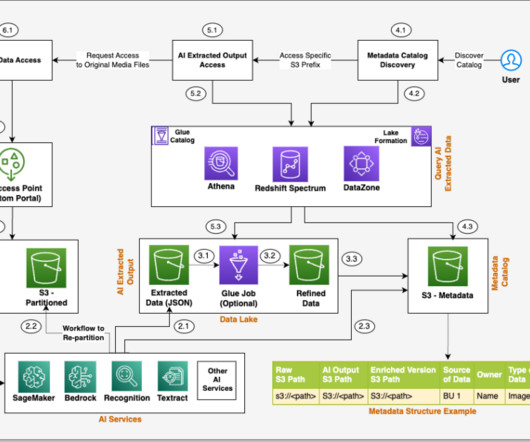
The next generation of SageMaker also introduces new capabilities, including Amazon SageMaker Unified Studio (preview) , Amazon SageMaker Lakehouse , and Amazon SageMaker Data and AI Governance. This feature is now available in all the AWS commercial Regions where Amazon DataZone is supported.
However, enterprise data generated from siloed sources combined with the lack of a data integration strategy creates challenges for provisioning the data for generative AI applications. Data governance is a critical building block across all these approaches, and we see two emerging areas of focus.
HUE also comes with a simplistic form of pre-visualization of results and download result sets as csv files or pdfs, for local exploration or further insight sharing. It, therefore, makes sense to provide a seamless transition from the context of HUE to Cloudera’s new, built-in DataVisualization tool.
BI technology is a series of technologies that can handle a large amount of structured and sometimes unstructureddata. Their purpose is to help identify, develop and otherwise tap the value of big data and create opportunities for new strategic businesses. Data querying & discovery. Datavisualization.
While these tools are extremely useful for creating polished, reusable, visual dashboards for presenting data-driven insights, they are far less flexible in their ability to produce the information required to form the basis of a predictive modeling task. Datavisualization blog posts are a dime a dozen. ref: [link].
She further explains how the traditional BI systems which offers datavisualization and building data lakes of structured and unstructureddata, compliant with KPIs and analytics infrastructure may not be adequate to handle the data explosion.
Data lakes are centralized repositories that can store all structured and unstructureddata at any desired scale. The power of the data lake lies in the fact that it often is a cost-effective way to store data. In the future of healthcare, data lake is a prominent component, growing across the enterprise.
Rely on interactive datavisualizations. Although it is not a specific step, using intuitive datavisualizations still goes into the BI strategy framework as an important element to consider when choosing the right tool for your company. For decades now, data analytics has been considered a segregated task.
With the rapid growth of technology, more and more data volume is coming in many different formats—structured, semi-structured, and unstructured. Data analytics on operational data at near-real time is becoming a common need. Then we can query the data with Amazon Athena visualize it in Amazon QuickSight.
Unstructureddata needs for generative AI Generative AI architecture and storage solutions are a textbook case of “what got you here won’t get you there.” In other words, storage platforms must be aligned with the realities of unstructureddata and the emerging needs of generative AI. Learn more here.
They’re often responsible for building algorithms for accessing raw data, too, but to do this, they need to understand a company’s or client’s objectives, as aligning data strategies with business goals is important, especially when large and complex datasets and databases are involved.
We organize all of the trending information in your field so you don't have to. Join 42,000+ users and stay up to date on the latest articles your peers are reading.
You know about us, now we want to get to know you!
Let's personalize your content
Let's get even more personalized
We recognize your account from another site in our network, please click 'Send Email' below to continue with verifying your account and setting a password.


Let's personalize your content