This site uses cookies to improve your experience. To help us insure we adhere to various privacy regulations, please select your country/region of residence. If you do not select a country, we will assume you are from the United States. Select your Cookie Settings or view our Privacy Policy and Terms of Use.
Cookie Settings
Cookies and similar technologies are used on this website for proper function of the website, for tracking performance analytics and for marketing purposes. We and some of our third-party providers may use cookie data for various purposes. Please review the cookie settings below and choose your preference.
Used for the proper function of the website
Used for monitoring website traffic and interactions
Cookie Settings
Cookies and similar technologies are used on this website for proper function of the website, for tracking performance analytics and for marketing purposes. We and some of our third-party providers may use cookie data for various purposes. Please review the cookie settings below and choose your preference.
Strictly Necessary: Used for the proper function of the website
Performance/Analytics: Used for monitoring website traffic and interactions
Someone hacks together a quickdemo with ChatGPT and LlamaIndex. The system is inconsistent, slow, hallucinatingand that amazing demo starts collecting digital dust. Check out the graph belowsee how excitement for traditional software builds steadily while GenAI starts with a flashy demo and then hits a wall of challenges?
I recently saw an informal online survey that asked users what types of data (tabular; text; images; or “other”) are being used in their organization’s analytics applications. The results showed that (among those surveyed) approximately 90% of enterprise analytics applications are being built on tabular data.
I recently saw an informal online survey that asked users which types of data (tabular, text, images, or “other”) are being used in their organization’s analytics applications. The results showed that (among those surveyed) approximately 90% of enterprise analytics applications are being built on tabular data.
A quick scan of the web will show you lots of things that ChatGPT can do. GPT-3 and GPT-4 are not open source, but are available for free and paid access. GPT-3 and GPT-4 are not open source, but are available for free and paid access. What is it, how does it work, what can it do, and what are the risks of using it?
You can read part 1 here and part 2 here , and watch part 3 here. This blog series follows the manufacturing and operations data lifecycle stages of an electric car manufacturer – typically experienced in large, data-driven manufacturing companies. The second blog dealt with creating and managing Data Enrichment pipelines.
Now more than ever, real-estate businesses must keep a close watch on revenue and liquidity. Fast access to information ensures that managers can spot problems and opportunities quickly when they arise and then address them in a timely manner. Such approaches are gaining popularity as economic uncertainty and volatility are prevalent.
With hackers now working overtime to expose business data or implant ransomware processes, data security is largely IT managers’ top priority. And if data security tops IT concerns, data governance should be their second priority. But it’s still not easy.
Notebooks are increasingly crucial in the data scientist’s toolbox. This form of interactive workflow was introduced to assist data scientists in documenting their work, facilitating reproducibility, and prompting collaboration with their team members. Notebook Structure.
IBM watsonx is changing the game for enterprises of all shapes and sizes, making it easy for them to embed generative AI into their operations. Watsonx gives organizations the ability to refine foundation models with their own domain-specific data to gain competitive advantage and ensure factual grounding to external sources of knowledge.
As the use of ChatGPT becomes more prevalent, I frequently encounter customers and data users citing ChatGPT’s responses in their discussions. I love the enthusiasm surrounding ChatGPT and the eagerness to learn about modern data architectures such as data lakehouses, data meshes, and data fabrics.
In the business landscape of 2019, data is the only currency that matters. The success of any business into the next year and beyond will depend entirely on the volume, accuracy, and reportability of the data they collect—and how well the business can analyze, extract insight from, and take action on that data.
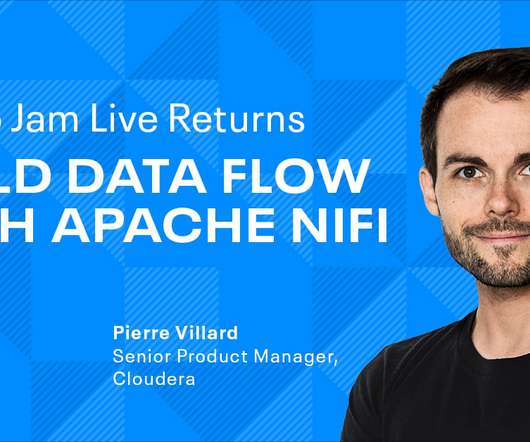
Over the last few weeks, I delivered four live NiFi demo sessions, showing how to use NiFi connectors and processors to connect to various systems, with 1000 attendees in different geographic regions. Interactive demo sessions and live Q&A are what we all need these days when working remotely from home is now a norm.
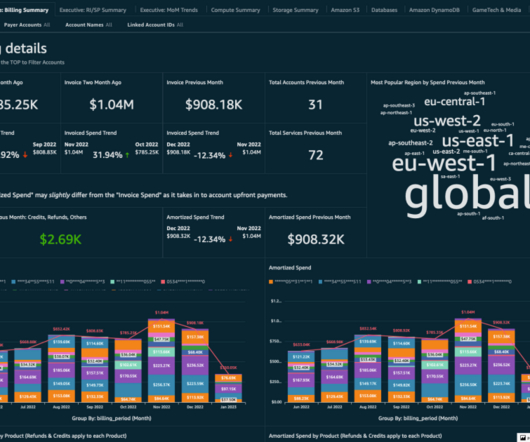
The challenge Buying and selling AWS differently means that the cost and usage data available to Strategic Blue on the AWS Management Console only matches what they purchased—not what their customers purchased. Over the years, they’ve been able to help customers save millions by maximizing commitments.
APIs serve as essential connectors between the growing number of data sources and applications in companies of all sizes and in all industries. This means that businesses are relying on and creating more APIs than ever before to get the data they need to power their applications and experiences, and scale their operations.
And, I was starting to give data presentations at conferences as a regular part of my job. After the events, we’d stay in touch, and I started getting requests for data tutoring. “I I didn’t want people to get bored while watching the videos, so I talked reallyreallyreally fast in an effort to hold their attention.
With the latest release of Cloudera DataFlow for the Public Cloud (CDF-PC) we added new CLI capabilities that allow you to automate data flow deployments, making it easier than ever before to incorporate Apache NiFi flow deployments into your CI/CD pipelines. Understanding the data flow development lifecycle.
Watch Use the Tools You Already Have to Create the Financial Report Your Board Needs Right Now. Easy Excel Connectivity. Unfortunately, you can’t do much with Excel until you have moved data into it from whatever source system (or systems) you want to analyze. The other common scenario is copying and pasting data.
Cloudera DataFlow for the Public Cloud (CDF-PC) is a cloud-native service for Apache NiFi within the Cloudera Data Platform (CDP). Since its initial release in 2021, CDF-PC has been helping customers solve their data distribution use cases that need high throughput and low latency requiring always-running clusters.
As technology advances, the use of data-driven dashboards is becoming increasingly important. As a result, they allow you to improve your plans and act on the data in real-time. These KPI metrics are critical data to analyze and evaluate a company’s sales, human resources, and marketing, and operational activities.
In this post, we explain how you can enable business users to ask and answer questions about data using their everyday business language by using the Amazon QuickSight natural language query function, Amazon QuickSight Q. Q uses the same QuickSight datasets you use for your dashboards and reports so your data is governed and secured.
To fulfil these needs, you need direct access to accurate data from your ERP, and the ability to quickly create drillable Excel reports for GL and other finance requirements. That’s why many finance teams resort to dumping data into Excel and formatting them there to meet their reporting needs.
With the advent of Business Intelligence Dashboard (BI Dashboard), access to information is no longer limited to IT departments. Every user can now create interactive reports and utilize data visualization to disseminate knowledge to both internal and external stakeholders.
Data Governance is growing essential. Data growth, shrinking talent pool, data silos – legacy & modern, hybrid & cloud, and multiple tools – add to their challenges. Hence, they are pursuing cloud transformation to help manage growth in data and cost. Meanwhile, data scientists and analysts need access to data.
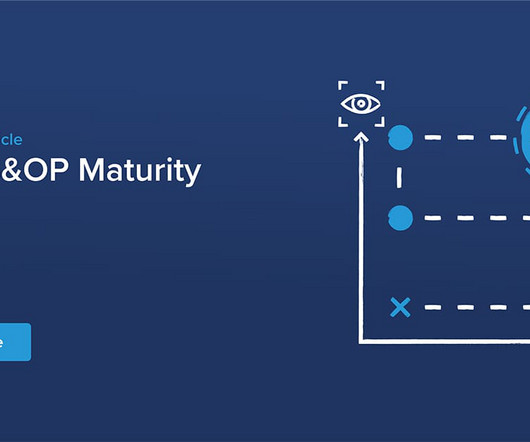
There’s a lack of transparency, trust and thus data acceptance. What does maximum maturity mean in the 5-step Gartner Sales & Operations Model and how do you get there? Specialist smartPM.solutions has the answer and shares their solution with you in this article. Figure 1: 5 Stages of the Gartner S&OP Maturity Model.
Hence, I have been obsessed with encouraging you to get actual data to learn from. The problem for many new or experienced analysts has been that they either don't have access to any dataset (newbies) or the data they have access to is finite or from an incomplete or incorrect implementation (experienced).
the analysis of qualitative and quantitative data from your website and the competition, 2. the analysis of qualitative and quantitative data from your website and the competition, 2. An expansive view of what it means to use data online, both from the type of data perspective and the kind of desired impact perspective.
Rapidly changing occupancy patterns, volatility in the economy, and tightening liquidity are forcing real estate professionals to remain agile – keeping a close watch on cash flow, maintaining good relationships with lenders, and closely monitoring external factors that impact the real estate market.
Add in continuing geopolitical instability, and it’s easy to see why operating plans for 2025 are unlikely to look significantly different from 2024 plans. Add in continuing geopolitical instability, and it’s easy to see why operating plans for 2025 are unlikely to look significantly different from 2024 plans.
By leveraging data analysis to solve high-value business problems, they will become more efficient. This is in contrast to traditional BI, which extracts insight from data outside of the app. Introduction Why should I read the definitive guide to embedded analytics? CRM, ERP, EHR/EMR) or portals (e.g., intranets or extranets).
Although Oracle E-Business Suite (EBS) provides a centralized hub for financial data, the manual process of exporting data into spreadsheets is both time-consuming and prone to errors, forcing finance teams to spend considerable time verifying numbers. How do you ensure greater efficiency and accuracy for your financial reports?
Having easy-to-read and straightforward board reports is something many companies can work on to forward their vision. While reports are important, many board members aren’t taking the contents of board reports to mind. How can you help your company get ahead with comprehensive board reporting that hits home? What Is a Board Report?
few key ways to reduce skills gaps are streamlining processes and improving data management. While many finance leaders plan to address the skills gap through hiring and employee training and development, a significant percentage of leaders are also looking to data automation to bridge the gap. What Causes Skills Gaps?
If you’re relying on JasperReports or Crystal Reports to power your data reporting and insights, you’ve likely heard the news: many popular versions are reaching end-of-life, and it’s time to start planning your next steps. x are phasing out while newer versions like 9.0.0 promise extended support and new features.
From day-to-day operational finances to large capital expenditure (CAPEX) budgeting, here are the financial KPIs that the CEO should be keeping an eye on: Quick Ratio (acid test) : CEOs are often put in a position in which they need to quickly check the company’s financial health. More often than not, a CEO will use the quick ratio for this.
The constituents cannot hold their government responsible without having access to periodic reporting on key performance metrics. A government key performance indicator (KPI) is a quantifiable measure that the public sector uses to evaluate its performance. They provide information that directly describes the government’s activities.
For virtually everyone in your organization, EPM reporting can be a powerful tool for defining clearly measurable targets, monitoring performance, and bringing your data to life. EPM gives you up-to-the-minute information to help people throughout your company make smart decisions quickly. EPM, Simplified. Download Now.
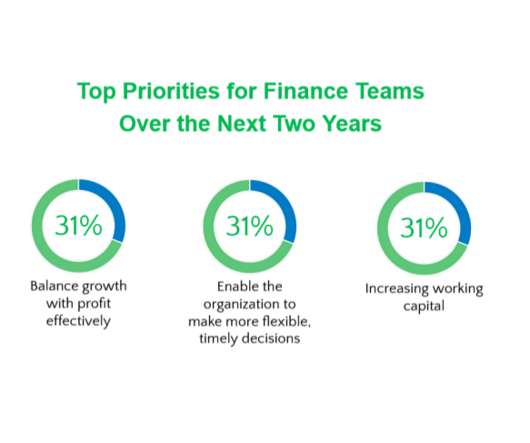
Without sufficient time to analyze the data they have thoroughly, finance professionals are hard-pressed to draw the type of in-depth insights they need to form strategic plans for balancing growth and profit effectively. As organizational priorities shift, so too do the priorities of finance teams. Here’s what they had to say: Priority 1.
Real-Time Access to Your Most Important Data. Real-Time Access to Your Most Important Data. They are the strategic thinkers that see the big picture, ask the important questions, and ultimately guide the company toward success. To do that, they need the right information.
Broad-brush changes, such as increasing all personnel expenses by 3.1%, are relatively easy to make, and they don’t necessarily require a lot of thought or extensive discussion, which makes this method easier and less time-consuming. Traditionally, most businesses approach budgeting as an adjustment to the status quo. Incremental Budgeting.
That means embracing technology for streamlined processes, accurate data, and better collaboration. Its seamless integration into the ERP system eliminates many of the common technical challenges associated with software implementation; unlike other tools that make you customize data models, Jet Reports works directly with the BC data model.
Access Resource. They also must present those financials to the project managers or teams, which can be done using a BI tool that presents that data in an easy-to-use dashboard. . Our valued partner, Deltek is a leading provider of software and information solutions for project-based businesses.
For small entrepreneurial businesses, equity compensation can be a very attractive way to attract and retain highly talented employees. Equity compensation may also apply to non-employee services provided by independent contractors, board members, or advisors. It’s a win for employees and contractors because the potential upside can be very high.
While Microsoft Dynamics is a powerful platform for managing business processes and data, Dynamics AX users and Dynamics 365 Finance & Supply Chain Management (D365 F&SCM) users are only too aware of how difficult it can be to blend data across multiple sources in the Dynamics environment.
Dashboards are screens or pages that display information in a unified view that makes data easily digestible for end users. Embedded dashboards are screens that display data and analytics within existing business applications. What Are Embedded Dashboards? or consumer applications (Fitbit, your personal banking app, etc.).
We organize all of the trending information in your field so you don't have to. Join 42,000+ users and stay up to date on the latest articles your peers are reading.
You know about us, now we want to get to know you!
Let's personalize your content
Let's get even more personalized
We recognize your account from another site in our network, please click 'Send Email' below to continue with verifying your account and setting a password.


Let's personalize your content