This site uses cookies to improve your experience. To help us insure we adhere to various privacy regulations, please select your country/region of residence. If you do not select a country, we will assume you are from the United States. Select your Cookie Settings or view our Privacy Policy and Terms of Use.
Cookie Settings
Cookies and similar technologies are used on this website for proper function of the website, for tracking performance analytics and for marketing purposes. We and some of our third-party providers may use cookie data for various purposes. Please review the cookie settings below and choose your preference.
Used for the proper function of the website
Used for monitoring website traffic and interactions
Cookie Settings
Cookies and similar technologies are used on this website for proper function of the website, for tracking performance analytics and for marketing purposes. We and some of our third-party providers may use cookie data for various purposes. Please review the cookie settings below and choose your preference.
Strictly Necessary: Used for the proper function of the website
Performance/Analytics: Used for monitoring website traffic and interactions
This is not the first time that I’ve written about AI creativity, and I doubt that it will be the last. AI can write poems—not terribly well, but they certainly rhyme, and they can be prompted to convey certain sentiments. That’s a path that’s well worth investigating. Remember all the “Uber for X” startups?
For several years now, the elephant in the room has been that data and analytics projects are failing. Gartner estimated that 85% of big data projects fail. Add all these facts together, and it paints a picture that something is amiss in the data world. . Data engineers end up fixing the same problem over and over.
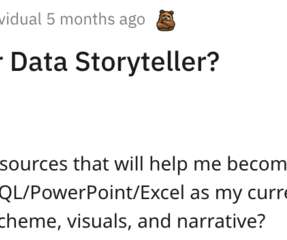
How to get started with data storytelling? For the beginner — and even for the experienced data analyst or data scientist — data storytelling can be a vague, disorientating concept. The “lastmile” of analytics Data storytelling is about helping make your work pay off. How do they best absorb data?
The following is an excerpt from Chapter 1 of Data Fluency: Empowering Your Organization with Effective Data Communication. Few people, and fewer organizations, consistently engage with the data and use it to guide their thinking. Organizational constraints inhibit the effective use of data.
Spinning up a chatbot or adopting an AI assistant aren’t likely to tax most enterprises’ storage capacities, but large AI projects with access to millions of data points may require many terabytes of new storage, potentially costing tens of millions of dollars, some AI and storage experts say. Last year, Duos scanned 8.5
Data Warehousing. This is a huge miss… Left to their own accord, how many companies will make the same decisions data would recommend? Transforming Data’s Strategic Influence. application in data to new and unexplored areas. application in data to new and unexplored areas. Paid Media. Owned Media. Customer Service.
Browser extensions have been under the spotlight in enterprise security news recently due to the wave of OAuth attacks on Chrome extension developers and data exfiltration attacks. This revelation suggests that virtually any browser extension could potentially serve as an attack vector if created or taken over by an attacker.
GM set up BrightDrop in January 2021 to modernize first- and last-mile transport with an integrated ecosystem of electric vans and motorized pallets. GM set up BrightDrop in January 2021 to modernize first- and last-mile transport with an integrated ecosystem of electric vans and motorized pallets.
As in, the former is in the business of providing data, the latter in the business of understanding the performance implied by the data. Even if you have really amazing why and so what , I've observed many Analysts die at the lastmile: Presenting their whys and the so whats, in the form of stories. In fact 86.4%
But setting these vital enterprises up for maximum success and unrivaled innovation takes information — and that means gathering data. If you represent a manufacturing concern and you’re wondering about the benefits of capturing and analyzing operational data , you’ve come to the right place.
GM set up BrightDrop in January 2021 to modernize first- and last-mile transport with an integrated ecosystem of electric vans and motorized pallets. GM set up BrightDrop in January 2021 to modernize first- and last-mile transport with an integrated ecosystem of electric vans and motorized pallets.
There are three elements to our "big data" efforts, or unhyped normal data efforts: Data Collection, Data Reporting, and Data Analysis. The lastmile. Data presentation! You want to show them all data stuff and how much you worked and how cool your technique was.
Our recent survey showed that 97% of data engineers report experiencing burnout in their day-to-day jobs. Finding problems before your customers know they exist helps your team’s happiness, productivity, customer trust, and customer data success. That idea is the Data Journey.
Notebooks are increasingly crucial in the data scientist’s toolbox. This form of interactive workflow was introduced to assist data scientists in documenting their work, facilitating reproducibility, and prompting collaboration with their team members. Notebook Structure.
Given that title, it is amazing that the whole thing has lasted a decade! :). What's interesting is that I started the blog, very deliberately, only writing two posts a week. Then as I grew busy after the first book, Web Analytics: An Hour A Day was published, June 2007, I started writing once a week to keep the quality high.
The last two years have seen remarkable acceleration of digital transformation in a whole host of segments. Separated by Eight Miles and 70 years. Most blogs in my history are very focused on Industry 4.0’s s digital transformation of the manufacturing industry, which in itself is pretty remarkable. By 2025, Industry 4.0 and sold 322.1
In this post, I want to analyse the current PASS situation, explain some broader context, and give people a more data-driven view. I hope that this leads to a calmer discussion by providing additional information and data. I want to help by providing data and insights on the recent PASS row online.
Just when you thought you were finally getting more comfortable with website analytics and the metrics you report, here comes the massive explosion of mobile data! At one level it is the normal impressions and clicks data, but on another level we are getting new data and metrics we normally don't use. How cool is that!
“Are you going to write a blog post about taking 3 months off??” After 7 weeks, 20 states, and 7,412 miles, we were home. a colleague asked me. “I I wasn’t planning on it. I wanted to take off the summer to be with my kids, so I did. I didn’t do anything profound.”. — Here’s how it worked. We slipped ‘n’ slid in the backyard.
What your boss wants most this year, more than love, is to be told what the data wants her to do. In those moments – common around new years or new annual planning cycles – the difference between delivering an incremental change vs. a step change is the quality of ideas you are considering. The Step Change Analytics Obsessions List.
Application modernization starts with assessment of current legacy applications, data and infrastructure and applying the right modernization strategy (rehost, re-platform, refactor or rebuild) to achieve the desired result. Duplicative capabilities across applications and channels give rise to duplicative IT resources (e.g.,
Digital commerce has gained prominence over the last two decades as consumers have increasingly switched to consuming products and services on various digital channels. Digital commerce has gained prominence over the last two decades as consumers have increasingly switched to consuming products and services on various digital channels.
We’ll have 10 minute breaks every hour , and the last 30 minutes is reserved for extra Q&A time. I spend weeks every year re-recording, re-editing, re-uploading, re-making handouts, re-writing ebooks, and re-creating templates. No more pressure to find time in your already-packed schedule for implementation. Never again.
Too many new things are happening too fast and those of us charged with measuring it have to change the wheels while the bicycle is moving at 30 miles per hour (and this bicycle will become a car before we know it – all while it keeps moving, ever faster). Part of it fueled by Vendors. What a competitive bunch!
Drawing straws in my head, I’m going to have to go with my recent promotion from an analytics/development role (big data marketing segmentation would maybe be the best way to describe it) to a product management role… But it wasn’t the promotion that was significant. I have felt a lot more confident since that moment.
by MICHAEL QUINN, JEREMY MILES, KA WONG As data scientists, we often encounter situations in which human judgment provides the ground truth. Overview Human-labeled data is ubiquitous in business and science, and platforms for obtaining data from people have become increasingly common. Some of this data is human-labeled.
They were succeeded by programmers writing machine instructions as binary code to be input one bit at a time by flipping switches on the front of a computer. They were succeeded by programmers writing machine instructions as binary code to be input one bit at a time by flipping switches on the front of a computer. I dont buy it.
The Johnstown Flood, the sinking of the Titanic, the explosion of the Hindenburg, the flawed response to Hurricane Katrina–each had a lasting impact. The Three Mile Island accident led to safety improvements across the nuclear power industry. Major catastrophes can transform industries and cultures. A couple of years ago, U.S.
Analysts, honestly, make the world go round when it comes to any successful business – yes, data is that important. Today's post is an adjacent mistake: The cardinal sin of spending too much time with data and in reports! But, perhaps I'm at fault for creating the problem of you spending all your time with data.
When authors create datasets, build dashboards, and share with end-users, the users will see the same data as the author, unless row-level security (RLS) is enabled in the Amazon QuickSight dataset. The institution aims to streamline access control and maintain a single source of truth for data permissions across its entire data ecosystem.
Room goes quiet This scene has played out dozens of times over the last two years. Room goes quiet This scene has played out dozens of times over the last two years. Teams think theyre data-driven because they have dashboards, but theyre tracking vanity metrics that dont correlate with real user problems. This isnt surprising.
We organize all of the trending information in your field so you don't have to. Join 42,000+ users and stay up to date on the latest articles your peers are reading.
You know about us, now we want to get to know you!
Let's personalize your content
Let's get even more personalized
We recognize your account from another site in our network, please click 'Send Email' below to continue with verifying your account and setting a password.


Let's personalize your content